
Gumbel distribution facts for kids
The Gumbel distribution is a special type of probability distribution. It helps us understand and predict extreme values. Think of it as a tool that looks at the biggest (or smallest) numbers in a group of data.
For example, if you have a list of the highest river levels each year, the Gumbel distribution can help predict how high the river might get in the future. It's also useful for guessing the chance of big natural events like extreme earthquakes or floods happening.
Contents
What it Does
The Gumbel distribution is a continuous probability distribution. This means it can describe values that can be any number, not just whole numbers. It's a family of similar distributions. They differ based on two main things:
- Location: This is like the average of the distribution. It tells you where the center of the data is.
- Scale: This is like the standard deviation. It tells you how spread out the data is.
We often talk about two main ways to show the Gumbel distribution: the probability density function (PDF) and the cumulative distribution function (CDF).
Probability Density Function (PDF)

The PDF is a graph that shows how likely different values are to happen. Imagine a curve on a graph. The higher the curve, the more likely that value is.
If you want to know the chance of a value falling between two points (like A and B), you look at the area under the PDF curve between those points.
For example, in the picture of the normal distribution, the areas under the curve show the probability of values happening in different ranges. The Gumbel PDF is different from the normal one because it's not perfectly balanced. It's often "skewed" or leaning to one side.
Cumulative Distribution Function (CDF)

The CDF is another type of graph. It shows the chance that a value will be less than or equal to a certain number.
For example, if you look at the Gumbel CDF picture, the red curve shows that the chance of a value being less than 5 is 0.9 (or 90%). For the dark blue line, that chance is 0.7 (or 70%).
How it's Calculated
The Gumbel distribution uses some math to figure out these probabilities.
The CDF Formula
The main formula for the CDF looks like this:
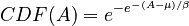
Don't worry too much about the complex symbols! Here's what they mean in simple terms:
- A is the value you're interested in.
- μ (pronounced "moo") is the mode. This is the value that appears most often, or where the PDF curve is highest.
- e is a special mathematical constant, about 2.718.
- β (pronounced "beta") is a value connected to the standard deviation (σ), which tells you how spread out the data is.

Here, π (pronounced "pie") is Pi, about 3.142. The symbol  means square root.
Mode, Median, and Mean
- The mode (μ) can be found using the median (M). The median is the middle value when all your data is lined up from smallest to largest.
- The mean (E(x)) is the average of all the values. It's also related to the mode and β.
Using the Gumbel Distribution
Scientists and engineers use the Gumbel distribution to analyze data. They can estimate the mode (μ) and β from real-world data like averages, medians, and standard deviations. Once they have these values, they can use the Gumbel CDF formula to figure out the probability of different events happening.
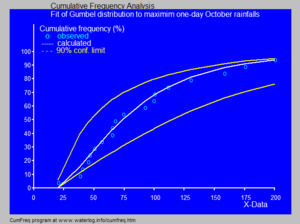
For example, in hydrology (the study of water), the Gumbel distribution is used to look at things like the highest rainfall amounts in a month or year, or the biggest river flows. It can even help describe times of drought.
The picture shows how the Gumbel distribution can be used to fit (or match) real data, like the highest one-day rainfall amounts in October.
Images for kids
-
A piece of graph paper that incorporates the Gumbel distribution.

See also
 In Spanish: Distribución de Gumbel para niños
