Harrisville, Ohio facts for kids
Quick facts for kids
Harrisville, Ohio
|
|
|---|---|
|
Village
|
|
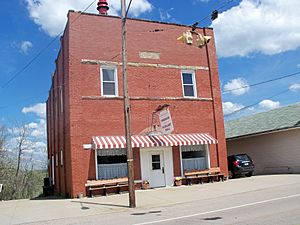
The Fireman and Auxiliary Hall on U.S. Route 250
|
|
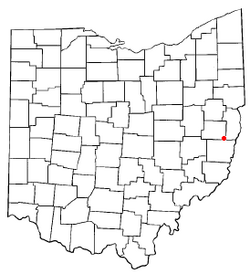
Location of Harrisville, Ohio
|
|
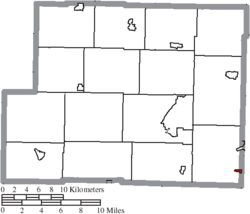
Location of Harrisville in Harrison County
|
|
| Country | United States |
| State | Ohio |
| County | Harrison |
| Area | |
| • Total | 0.15 sq mi (0.39 km2) |
| • Land | 0.15 sq mi (0.39 km2) |
| • Water | 0.00 sq mi (0.00 km2) |
| Elevation | 1,247 ft (380 m) |
| Population
(2020)
|
|
| • Total | 179 |
| • Estimate
(2023)
|
173 |
| • Density | 1,177.63/sq mi (455.12/km2) |
| Time zone | UTC-5 (Eastern (EST)) |
| • Summer (DST) | UTC-4 (EDT) |
| ZIP code |
43974
|
| Area code(s) | 740 |
| FIPS code | 39-34090 |
| GNIS feature ID | 2398255 |
Harrisville is a small village located in Harrison County, Ohio, in the United States. In 2020, about 179 people lived there. It's a quiet place with a rich history.
Contents
History of Harrisville
Harrisville was officially planned and created on October 19, 1814. Four people named John Wells, Thomas Gray, Store Hutchinson, and Robert Dutton helped to set up the village. John Wells was the main owner at the time.
Early Calls for Equality
In 1834, something very important happened in Harrisville. Women in the village made one of the first known demands for women to have the right to vote. Thirty-five women signed a special request. They asked the government to end slavery in Washington, D.C. They also asked for "immediate enfranchisement of every human being that shall tread this soil." This meant they wanted everyone, no matter their background, to have the right to vote right away.
Harrisville During the Civil War
During the American Civil War, in 1863, a famous event called Morgan's Raid took place. A Confederate general named John Hunt Morgan led his soldiers through several towns in Ohio. Harrisville was one of these towns. Morgan's journey ended in defeat for him at the Battle of Salineville. This was a victory for the Union side.
Geography of Harrisville
Harrisville is a very small village. It covers a total area of about 0.15 square miles (0.39 square kilometers). All of this area is land, meaning there are no large lakes or rivers within the village limits.
Population and People
| Historical population | |||
|---|---|---|---|
| Census | Pop. | %± | |
| 1850 | 300 | — | |
| 1860 | 261 | −13.0% | |
| 1870 | 258 | −1.1% | |
| 1880 | 318 | 23.3% | |
| 1890 | 252 | −20.8% | |
| 1900 | 256 | 1.6% | |
| 1910 | 364 | 42.2% | |
| 1920 | 356 | −2.2% | |
| 1930 | 380 | 6.7% | |
| 1940 | 442 | 16.3% | |
| 1950 | 420 | −5.0% | |
| 1960 | 343 | −18.3% | |
| 1970 | 345 | 0.6% | |
| 1980 | 324 | −6.1% | |
| 1990 | 308 | −4.9% | |
| 2000 | 259 | −15.9% | |
| 2010 | 235 | −9.3% | |
| 2020 | 179 | −23.8% | |
| 2023 (est.) | 173 | −26.4% | |
| U.S. Decennial Census | |||
Harrisville Population in 2010
According to the census from 2010, there were 235 people living in Harrisville. These people lived in 99 different homes, and 66 of these were families. Most of the people living in the village were White (99.6%). A small number (0.9%) were of Hispanic or Latino background.
The average age of people in Harrisville in 2010 was about 41 years old.
- About 18.7% of residents were under 18 years old.
- About 13.7% were between 18 and 24 years old.
- About 22.5% were between 25 and 44 years old.
- About 30.6% were between 45 and 64 years old.
- About 14.5% were 65 years old or older.
The village had slightly more males (51.5%) than females (48.5%).
See also
 In Spanish: Harrisville (Ohio) para niños
 | Claudette Colvin |
 | Myrlie Evers-Williams |
 | Alberta Odell Jones |

