Hartz Mountains (Tasmania) facts for kids
Quick facts for kids Hartz Mountains |
|
|---|---|

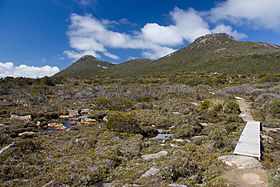
Hartz Mountain and Mount Snowy
|
|
| Highest point | |
| Elevation | 1,254 m (4,114 ft) AHD |
| Prominence | 838 m (2,749 ft) |
| Isolation | 16.16 km (10.04 mi) |
| Geography | |
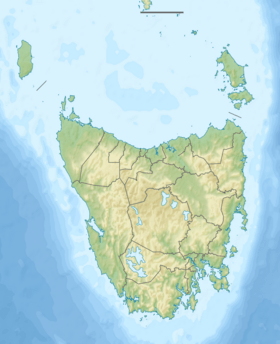
| Location | Southern Tasmania, Australia |
| Parent range | Hartz Range |
The Hartz Mountains are a cool set of mountains with two main peaks in southern Tasmania, Australia. They are about 55 kilometers (about 34 miles) southwest of Hobart, near a town called Geeveston. These mountains are part of the amazing Hartz Mountains National Park.
The weather in the Hartz Mountains area can change very quickly. You might experience snow, cold rain, low temperatures, strong winds, and thick upslope fog at any time of year. It's always a good idea to be prepared for all kinds of weather when you visit!
Exploring Hartz Peak
The highest point of the Hartz Mountains is called Hartz Peak. It stands tall at 1,254 meters (about 4,114 feet) above sea level. If the weather is clear, you can get some of the best views of the southwest and north of Tasmania from the top!
The walk to the summit of Hartz Peak is quite challenging. It takes about five hours to go there and back. This hike is best for people who are fit and have experience walking in the wilderness.
Mountain Weather
The climate data for the Hartz Mountains comes from a place called Keoghs Pimple. This weather station is located at an altitude of 831 meters (about 2,726 feet) and has been recording weather since 1996.
The Hartz Mountains area gets a lot of rain, with about 252 rainy days each year. However, the rain usually falls as light showers or drizzle rather than heavy downpours. The air is also very humid, especially in the afternoons.
| Climate data for Hartz Mountain (Keoghs Pimple, 1996–2022); 831 m AMSL; 43.20° S, 146.77° E | |||||||||||||
|---|---|---|---|---|---|---|---|---|---|---|---|---|---|
| Month | Jan | Feb | Mar | Apr | May | Jun | Jul | Aug | Sep | Oct | Nov | Dec | Year |
| Record high °C (°F) | 35.2 (95.4) |
32.6 (90.7) |
34.0 (93.2) |
24.3 (75.7) |
18.8 (65.8) |
14.8 (58.6) |
13.2 (55.8) |
16.6 (61.9) |
24.8 (76.6) |
26.5 (79.7) |
30.0 (86.0) |
34.0 (93.2) |
35.2 (95.4) |
| Mean daily maximum °C (°F) | 17.8 (64.0) |
17.2 (63.0) |
14.6 (58.3) |
11.1 (52.0) |
8.5 (47.3) |
6.9 (44.4) |
5.9 (42.6) |
6.6 (43.9) |
8.6 (47.5) |
11.0 (51.8) |
13.7 (56.7) |
15.1 (59.2) |
11.4 (52.6) |
| Mean daily minimum °C (°F) | 7.2 (45.0) |
7.1 (44.8) |
6.3 (43.3) |
4.6 (40.3) |
3.4 (38.1) |
2.3 (36.1) |
1.4 (34.5) |
1.3 (34.3) |
1.9 (35.4) |
2.7 (36.9) |
4.3 (39.7) |
5.3 (41.5) |
4.0 (39.2) |
| Record low °C (°F) | −0.1 (31.8) |
−0.2 (31.6) |
−0.8 (30.6) |
−1.8 (28.8) |
−2.5 (27.5) |
−3.0 (26.6) |
−3.7 (25.3) |
−4.4 (24.1) |
−3.4 (25.9) |
−3.4 (25.9) |
−2.8 (27.0) |
−1.2 (29.8) |
−4.4 (24.1) |
| Average precipitation mm (inches) | 61.9 (2.44) |
62.8 (2.47) |
74.5 (2.93) |
74.1 (2.92) |
90.9 (3.58) |
99.9 (3.93) |
104.6 (4.12) |
129.2 (5.09) |
97.7 (3.85) |
97.8 (3.85) |
78.3 (3.08) |
81.4 (3.20) |
1,097.4 (43.20) |
| Average precipitation days (≥ 0.2 mm) | 16.1 | 16.1 | 19.2 | 20.1 | 23.2 | 21.4 | 25.3 | 25.1 | 23.3 | 22.8 | 19.5 | 19.6 | 251.7 |
| Average afternoon relative humidity (%) | 67 | 69 | 77 | 84 | 90 | 91 | 92 | 86 | 84 | 79 | 73 | 73 | 80 |
| Source: Australian Bureau of Meteorology | |||||||||||||
 | Stephanie Wilson |
 | Charles Bolden |
 | Ronald McNair |
 | Frederick D. Gregory |


