Hoopa, California facts for kids
Quick facts for kids
Hoopa, California
|
|
|---|---|
| Country | United States |
| State | California |
| County | Humboldt |
| Native American Reservation | Hoopa Valley Indian Reservation |
| Elevation | 328 ft (100 m) |
| Population
(2020)
|
|
| • Total | 3,167 |
| Time zone | UTC-8 (Pacific) |
| • Summer (DST) | UTC-7 (PDT) |
| ZIP code |
95546
|
| Area code(s) | 530 |
| FIPS code | 06-34540 |
| GNIS feature ID | 2585654 |
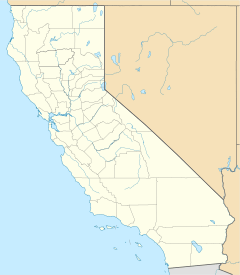
Hoopa is a small community in Humboldt County, California. It's a special kind of place called a census-designated place (CDP). This means it's a community that the government counts for population, but it's not officially a city. Hoopa is located about 10 miles (16 km) south of Weitchpec. It sits at an elevation of 328 feet (100 meters).
Hoopa is unique because it's entirely within the Hoopa Valley Indian Reservation. This reservation is the home of the Hupa people. Hoopa serves as the main center for the reservation. It is located right on the Trinity River. The area's postal code is 95546.
The Hoopa Valley post office first opened in 1861. Its name changed a few times before settling on Hoopa in 1902. Some of its older names included Hupa, Ho-pah, Hoo-pah, Hupo, and Up-pa.
What's the Weather Like in Hoopa?
The weather in Hoopa is similar to nearby Willow Creek. It has warm summers and mild, wet winters. The area gets a lot of rain, especially in the winter months. Summers are usually dry and hot.
| Climate data for Hoopa, California, averages 1997–present, extremes 1997–present | |||||||||||||
|---|---|---|---|---|---|---|---|---|---|---|---|---|---|
| Month | Jan | Feb | Mar | Apr | May | Jun | Jul | Aug | Sep | Oct | Nov | Dec | Year |
| Record high °F (°C) | 69 (21) |
77 (25) |
87 (31) |
96 (36) |
105 (41) |
109 (43) |
110 (43) |
111 (44) |
110 (43) |
95 (35) |
80 (27) |
65 (18) |
111 (44) |
| Mean maximum °F (°C) | 61.7 (16.5) |
68.0 (20.0) |
78.8 (26.0) |
87.0 (30.6) |
94.0 (34.4) |
100.5 (38.1) |
104.5 (40.3) |
104.5 (40.3) |
101.8 (38.8) |
85.9 (29.9) |
69.4 (20.8) |
59.9 (15.5) |
107.3 (41.8) |
| Mean daily maximum °F (°C) | 50.9 (10.5) |
57.2 (14.0) |
62.3 (16.8) |
67.4 (19.7) |
74.9 (23.8) |
82.2 (27.9) |
90.3 (32.4) |
90.2 (32.3) |
84.8 (29.3) |
72.6 (22.6) |
57.4 (14.1) |
50.7 (10.4) |
70.1 (21.2) |
| Daily mean °F (°C) | 43.9 (6.6) |
47.9 (8.8) |
51.1 (10.6) |
54.6 (12.6) |
60.0 (15.6) |
67.0 (19.4) |
72.8 (22.7) |
72.4 (22.4) |
68.2 (20.1) |
59.3 (15.2) |
49.6 (9.8) |
44.3 (6.8) |
57.6 (14.2) |
| Mean daily minimum °F (°C) | 36.8 (2.7) |
38.8 (3.8) |
39.9 (4.4) |
41.9 (5.5) |
45.1 (7.3) |
51.7 (10.9) |
55.4 (13.0) |
54.6 (12.6) |
51.5 (10.8) |
46.1 (7.8) |
41.9 (5.5) |
37.8 (3.2) |
45.1 (7.3) |
| Mean minimum °F (°C) | 26.0 (−3.3) |
29.0 (−1.7) |
32.2 (0.1) |
34.5 (1.4) |
37.1 (2.8) |
41.7 (5.4) |
46.7 (8.2) |
45.2 (7.3) |
41.6 (5.3) |
37.1 (2.8) |
32.8 (0.4) |
27.4 (−2.6) |
27.6 (−2.4) |
| Record low °F (°C) | 12 (−11) |
19 (−7) |
25 (−4) |
27 (−3) |
30 (−1) |
34 (1) |
41 (5) |
40 (4) |
36 (2) |
26 (−3) |
22 (−6) |
7 (−14) |
7 (−14) |
| Average precipitation inches (mm) | 10.33 (262) |
8.27 (210) |
8.03 (204) |
3.39 (86) |
1.69 (43) |
0.43 (11) |
0.11 (2.8) |
0.51 (13) |
1.09 (28) |
4.33 (110) |
8.90 (226) |
11.25 (286) |
58.33 (1,481.8) |
| Average snowfall inches (cm) | 0.4 (1.0) |
0.2 (0.51) |
0.3 (0.76) |
0.0 (0.0) |
0.0 (0.0) |
0.0 (0.0) |
0.0 (0.0) |
0.0 (0.0) |
0.0 (0.0) |
0.0 (0.0) |
0.1 (0.25) |
0.6 (1.5) |
1.6 (4.02) |
| Average precipitation days (≥ 0.01 in) | 15 | 14 | 15 | 11 | 6 | 1 | 0 | 1 | 3 | 8 | 14 | 16 | 104 |
| Source: National Weather Service | |||||||||||||
Who Lives in Hoopa?
This section talks about the people living in Hoopa. It's called demographics.
| Historical population | |||
|---|---|---|---|
| Census | Pop. | %± | |
| U.S. Decennial Census | |||
In 2000, the U.S. census counted 3,040 people in Hoopa. By 2010, this number grew to 3,393 people. These numbers include everyone living in the Hoopa Valley area, not just the small town itself.
The people living in Hoopa come from different backgrounds. In 2010, about 81.7% of the population was Native American. About 14.1% were White. Smaller groups included Asian people (0.3%) and Black or African American people (0.1%). About 2.9% of people identified as being from two or more races. Also, 4.5% of the population was Hispanic or Latino of any race.


