IS–LM model facts for kids
The IS–LM model, also called the Hicks–Hansen model, is a tool used in macroeconomics. It helps us understand the connection between interest rates and the overall economy. This includes the market for goods and services, and the money market.
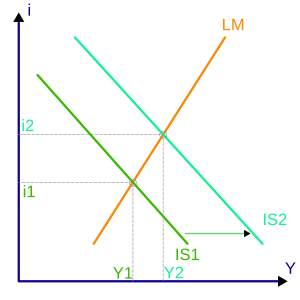
The model uses two main parts: the "investment–saving" (IS) curve and the "liquidity preference–money supply" (LM) curve. Where these two curves meet, it shows a "general equilibrium." This means the markets for goods and money are both balanced at the same time.
The IS–LM model can explain how national income changes when prices stay the same for a short time. It also shows why the aggregate demand curve might shift. This tool helps economists study how the economy changes and suggests ways to keep it stable.
John Hicks created this model in 1937. Later, Alvin Hansen added to it. It became a way to show Keynesian ideas using math. From the 1940s to the mid-1970s, it was a very important way to study the economy. Even though it's not used as much in advanced research today, it's still a key tool for students learning about macroeconomics. The IS–LM model helps us understand the short-term economy when prices are fixed. It also helps explain the AD–AS model.
Contents
History of the IS–LM Model
The IS–LM model was first shown at a meeting in Oxford in September 1936. Several economists, including John Hicks, presented their ideas. They wanted to create math models to explain John Maynard Keynes' famous book, General Theory of Employment, Interest, and Money. Hicks came up with the IS–LM model. He later wrote about it in his paper "Mr. Keynes and the Classics: A Suggested Interpretation."
Even though the model isn't perfect, it's still very helpful for teaching. It helps students understand the big questions that economists try to answer today. You'll find it in most college textbooks for economics beginners. However, it's often not in more advanced books. This is because newer ideas, like real business cycle and new Keynesian theories, are more common in advanced studies.
How the Model Works
The point where the IS and LM curves cross shows a short-term balance in the economy. This means that both the market for goods and services and the money market are in balance. This meeting point gives us a specific interest rate and a specific level of real GDP (Gross Domestic Product).
The IS (Investment–Saving) Curve
The IS curve shows how interest rates affect planned investment, which then affects national income and output.
On a graph, the IS curve slopes downwards. The interest rate (r) is on the vertical line, and GDP (Y) is on the horizontal line. The IS curve shows all the points where total spending equals total output. Total spending includes consumer spending, planned private investment, government spending, and net exports. Total output is the real income, or GDP.
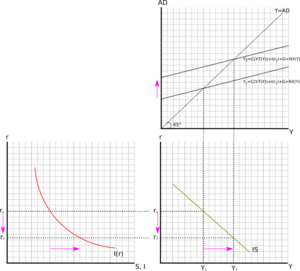
The IS curve also shows where total private investment equals total saving. Saving includes what people save, what the government saves (if it has a budget surplus), and what foreigners save (if there's a trade surplus). For every interest rate, there's a certain level of real GDP (Y) that balances these. Lower interest rates encourage more investment and spending. This increase in investment then boosts real GDP, which is called the multiplier effect. This is why the IS curve slopes downwards. In short, the IS curve explains how lower interest rates lead to more investment and higher national income.
The LM (Liquidity-Money) Curve
The LM curve shows all the combinations of interest rates and real income levels where the money market is in balance. This means the demand for money equals the supply of money.
On a graph, the LM curve slopes upwards. The interest rate is on the vertical line, and income is on the horizontal line.
The demand for money (also called liquidity preference) is how much cash people want to hold. People want to hold more cash when interest rates are lower. Two main things affect how much cash people want:
- Transactions demand: This is money needed for everyday buying and for emergencies. When real GDP goes up, people need more money for transactions.
- Speculative demand: This is money people hold instead of investing in things like stocks or bonds. When interest rates are high, the cost of holding cash (instead of earning interest) is high. So, people want to hold less cash for speculation.
The money supply is decided by the central bank and how much commercial banks are willing to lend. The money supply is usually shown as a straight vertical line. This means it doesn't change with interest rates or GDP.
When GDP increases, people need more money for transactions. This shifts the money demand curve to the right, which pushes up the interest rate. This is why the LM curve slopes upwards.
How the Curves Shift
The IS and LM curves can move, showing how different economic policies or events affect the economy.
If the government spends more money (this is called fiscal policy), it's like there's more demand for goods at every interest rate. This makes the IS curve shift to the right. When the IS curve shifts right, both the interest rate and national income go up. This new balance point is called aggregate demand.
Some economists believe that government spending can actually encourage private investment, especially if it's on useful public projects like roads or hospitals. This can help the economy grow in the long run. How much government spending affects the economy depends on the shape of the LM curve. If the LM curve is relatively flat, a shift in the IS curve can greatly increase output with little change in interest rates. If the LM curve is very steep, a shift in the IS curve will mostly lead to higher interest rates, with little change in output.
The IS curve can also shift right if there's an increase in investment spending, consumer spending, or exports. These changes also raise both income and interest rates. If these things decrease, the IS curve shifts to the left.
The IS–LM model also shows how monetary policy works. If the central bank increases the money supply, the LM curve shifts downwards or to the right. This lowers interest rates and increases national income. If people want to hold less cash (maybe because of better ways to pay), the LM curve also shifts downwards. This leads to more income and lower interest rates. Changes in the opposite direction will shift the LM curve in the opposite way.
Using the Model in Larger Economic Ideas
By itself, the IS–LM model helps us understand the economy in the short term when prices are fixed. But it's often used as a part of bigger models, like the AD–AS model (Aggregate Demand-Aggregate Supply model). These larger models allow prices to change.
In the AD–AS model, each point on the aggregate demand curve comes from the IS–LM model. For example, if prices go up, the real money supply (M/P) goes down. This shifts the LM curve upwards in the IS–LM model, leading to lower aggregate demand. So, at a higher price level, the total demand is lower, which is why the aggregate demand curve slopes downwards.
Adding the FE (Full Equilibrium) Component: The IS–LM–FE Model
John Hicks, who won a Nobel Prize, created the IS–LM model in 1937. He based it on ideas from John Maynard Keynes' book, The General Theory of Employment, Interest, and Money. Hicks first assumed that prices stayed fixed. This was because Keynes believed that wages and prices don't change quickly to balance markets.
To make the model more realistic, we can allow prices to change. When we do this, we need to add a third part: the full equilibrium (FE) condition. When this FE part is added, the model becomes the IS–LM–FE model. This new model is often used to study economic ups and downs, predict future economic trends, and help with economic policymaking.
Using the IS–LM–FE model has many benefits. It allows us to use one model to understand both classical and Keynesian economic ideas. This helps us see where these two approaches agree and where they differ. Also, since different versions of the IS–LM–FE model are often used in economic discussions, learning it helps you understand current economic debates. Economists use graphs, numbers, and math equations to study this model.
See also
 In Spanish: Modelo IS-LM para niños
- Keynesian cross
- AD–IA model
- IS/MP model
- Mundell–Fleming model
- National savings
- Policy mix
 | Chris Smalls |
 | Fred Hampton |
 | Ralph Abernathy |


