Indian Creek, Illinois facts for kids
Quick facts for kids
Indian Creek, Illinois
|
|
|---|---|
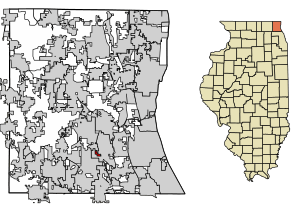
Location of Indian Creek in Lake County, Illinois.
|
|
Location of Illinois in the United States
|
|
| Country | United States |
| State | Illinois |
| County | Lake |
| Area | |
| • Total | 0.27 sq mi (0.69 km2) |
| • Land | 0.27 sq mi (0.69 km2) |
| • Water | 0.00 sq mi (0.00 km2) |
| Population
(2020)
|
|
| • Total | 536 |
| • Density | 2,007.49/sq mi (775.20/km2) |
| Time zone | UTC-6 (CST) |
| • Summer (DST) | UTC-5 (CDT) |
| ZIP Code(s) |
60061
|
| Area codes | 847, 224 |
| FIPS code | 17-37218 |
Indian Creek is a small village in Lake County, Illinois, United States. It is part of the larger Chicago metropolitan area, which is a huge urban region around the city of Chicago. According to the 2020 census, about 536 people live here. The village gets its police help from the Lake County Sheriff. Fire and emergency medical services (EMS) are provided by the Countryside Fire Protection District.
Contents
Where is Indian Creek Located?
Indian Creek is found at these coordinates: 42°13′33″N 87°58′37″W. This means it's in the northern part of Illinois.
Size of the Village
Indian Creek is quite small. In 2010, its total area was about 0.26 square miles (0.67 square kilometers). All of this area is land. It is the smallest village in Lake County.
How Many People Live in Indian Creek?
The number of people living in Indian Creek has changed over the years. Here's a look at the population from different census years:
| Historical population | |||
|---|---|---|---|
| Census | Pop. | %± | |
| 1960 | 239 | — | |
| 1970 | 270 | 13.0% | |
| 1980 | 236 | −12.6% | |
| 1990 | 247 | 4.7% | |
| 2000 | 194 | −21.5% | |
| 2010 | 462 | 138.1% | |
| 2020 | 536 | 16.0% | |
| U.S. Decennial Census 2010 2020 |
|||
Population Details from 2020
The 2020 census gives us a closer look at the people living in Indian Creek. This table shows the different groups of people in the village.
| Race / Ethnicity | Pop 2010 | Pop 2020 | % 2010 | % 2020 |
|---|---|---|---|---|
| White alone (NH) | 333 | 319 | 72.08% | 59.51% |
| Black or African American alone (NH) | 10 | 23 | 2.16% | 4.29% |
| Native American or Alaska Native alone (NH) | 0 | 5 | 0.00% | 0.93% |
| Asian alone (NH) | 83 | 140 | 17.97% | 26.12% |
| Pacific Islander alone | 0 | 0 | 0.00% | 0.00% |
| Some Other Race alone (NH) | 0 | 3 | 0.00% | 0.56% |
| Mixed Race/Multi-Racial (NH) | 5 | 19 | 1.08% | 3.54% |
| Hispanic or Latino (any race) | 31 | 27 | 6.71% | 5.04% |
| Total | 462 | 536 | 100.00% | 100.00% |
Note: The US Census counts Hispanic/Latino people as an ethnic group. This table separates them from the racial categories. People who are Hispanic/Latino can be of any race.
See also
 | Mary Eliza Mahoney |
 | Susie King Taylor |
 | Ida Gray |
 | Eliza Ann Grier |

