Kävlinge Municipality facts for kids
Quick facts for kids
Kävlinge Municipality
Kävlinge kommun
|
||
|---|---|---|
 |
||
|
||
 |
||
| Country | Sweden | |
| County | Scania County | |
| Seat | Kävlinge | |
| Area | ||
| • Total | 293.68 km2 (113.39 sq mi) | |
| • Land | 153.83 km2 (59.39 sq mi) | |
| • Water | 139.85 km2 (54.00 sq mi) | |
| Area as of January 1, 2010. | ||
| Population
(June 30, 2012)
|
||
| • Total | 28,815 | |
| • Density | 98.117/km2 (254.122/sq mi) | |
| Time zone | UTC+1 (CET) | |
| • Summer (DST) | UTC+2 (CEST) | |
| ISO 3166 code | SE | |
| Province | Scania | |
| Municipal code | 1261 | |
| Website | www.kavlinge.se | |
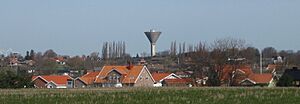
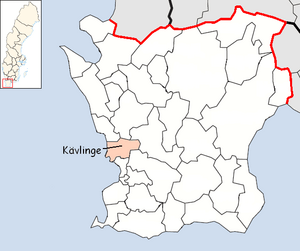
Kävlinge Municipality (which is called Kävlinge kommun in Swedish) is a special type of local government area in southern Sweden. It's located in a region called Scania County. The main town and administrative center of the municipality is Kävlinge.
Contents
Towns and Villages in Kävlinge
Kävlinge Municipality is home to several towns and villages, which are also known as urban areas or Tätort in Sweden. These are places where many people live close together. The table below shows the largest towns and villages in the municipality, based on how many people lived there in 2005. The main town, Kävlinge, is shown in bold.
| # | Locality | Population |
|---|---|---|
| 1 | Kävlinge | 10,500 |
| 2 | Löddeköpinge | 5,582 |
| 3 | Furulund | 3,888 |
| 4 | Hofterup | 3,243 |
| 5 | Dösjebro | 752 |
| 6 | Sandskogen | 533 |
| 7 | Barsebäck | 509 |
| 8 | Barsebäckshamn | 401 |
| 9 | Lilla Harrie | 321 |
One interesting fact is that Barsebäck used to have a nuclear power plant. This plant was built in the 1970s. However, it was closed down in 2005. This happened after many years of discussions, especially from nearby Copenhagen in Denmark, which is just across the Öresund Sound.
How People Vote in Kävlinge
In Sweden, people vote in elections to choose who will represent them in the government. This includes voting for people who will make decisions for their local municipality, like Kävlinge. These elections help decide how the municipality is run and what projects get funded.
People in Kävlinge Municipality vote for different political parties. These parties have different ideas about how things should be done. The results of these votes show which parties are most popular in the area.
For many years, the results of some smaller parties, like the Sweden Democrats, were not officially published because they were very small across the country. But now, all party results are usually shared. When people vote, it's called "Turnout," and it shows how many eligible voters actually cast a ballot.
Connections with Other Places
Kävlinge Municipality has a special connection with another place far away. This is called a "twinning" or "sister city" relationship. It helps people from different countries learn about each other's cultures.
See also
 In Spanish: Municipio de Kävlinge para niños
 | Emma Amos |
 | Edward Mitchell Bannister |
 | Larry D. Alexander |
 | Ernie Barnes |


