Killbuck, Ohio facts for kids
Quick facts for kids
Killbuck, Ohio
|
|
|---|---|
|
Village
|
|

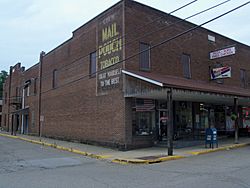
Killbuck Post Office
|
|

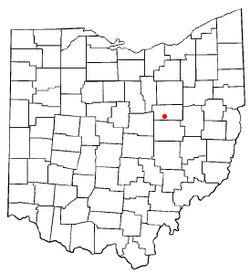
Location of Killbuck, Ohio
|
|

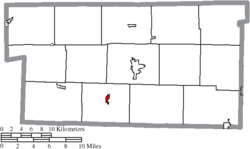
Location of Killbuck in Holmes County
|
|
| Country | United States |
| State | Ohio |
| County | Holmes |
| Township | Killbuck |
| Area | |
| • Total | 0.36 sq mi (0.94 km2) |
| • Land | 0.36 sq mi (0.94 km2) |
| • Water | 0.00 sq mi (0.00 km2) |
| Elevation | 863 ft (263 m) |
| Population
(2020)
|
|
| • Total | 810 |
| • Density | 2,243.77/sq mi (865.55/km2) |
| Time zone | UTC-5 (Eastern (EST)) |
| • Summer (DST) | UTC-4 (EDT) |
| ZIP code |
44637
|
| Area code(s) | 330 |
| FIPS code | 39-40180 |
| GNIS feature ID | 2398346 |
Killbuck is a small village located in Holmes County, Ohio, in the United States. It sits right next to Killbuck Creek. The village gets its name from a famous Lenape chief named Bemino, who was also known as John Killbuck Sr. In 2020, about 810 people lived in Killbuck.
Contents
About Killbuck Village
Killbuck is a quiet place in Ohio. It's known for its connection to nature, being near the Killbuck Creek. This creek is an important waterway in the area. The village has a rich history tied to the Native American Lenape people.
Where is Killbuck Located?
Killbuck is in Holmes County, Ohio. The entire village covers a small area of land. It is about 0.94 square kilometers (or 0.36 square miles) in size. All of this area is land, with no large bodies of water inside the village limits.
How Many People Live in Killbuck?
The number of people living in Killbuck has changed over the years. Here's a look at the population from different census counts:
| Historical population | |||
|---|---|---|---|
| Census | Pop. | %± | |
| 1880 | 262 | — | |
| 1900 | 370 | — | |
| 1910 | 400 | 8.1% | |
| 1920 | 575 | 43.8% | |
| 1930 | 703 | 22.3% | |
| 1940 | 716 | 1.8% | |
| 1950 | 767 | 7.1% | |
| 1960 | 865 | 12.8% | |
| 1970 | 893 | 3.2% | |
| 1980 | 937 | 4.9% | |
| 1990 | 809 | −13.7% | |
| 2000 | 839 | 3.7% | |
| 2010 | 817 | −2.6% | |
| 2020 | 810 | −0.9% | |
| U.S. Decennial Census | |||
Killbuck Population in 2010
In 2010, the village had 817 residents. These people lived in 334 different homes. Most of the people living in Killbuck were White (99.1%). A very small number were Asian or from other backgrounds. About 0.5% of the population identified as Hispanic or Latino.
Many homes (33.8%) had children under 18 living there. About 42.5% of the homes were married couples. Some homes were led by a single parent. The average number of people in each home was about 2.45.
The average age of people in Killbuck in 2010 was 38 years old.
- About 27.5% of residents were under 18.
- About 6.2% were between 18 and 24.
- About 25.1% were between 25 and 44.
- About 26.3% were between 45 and 64.
- About 14.9% were 65 years old or older.
More females lived in the village than males in 2010. About 55.3% of the population was female, and 44.7% was male.
See also
 In Spanish: Killbuck (Ohio) para niños
 | Valerie Thomas |
 | Frederick McKinley Jones |
 | George Edward Alcorn Jr. |
 | Thomas Mensah |

