Laurel Mountain (Oregon) facts for kids
Quick facts for kids Laurel Mountain |
|
|---|---|
| Highest point | |
| Elevation | 3,592 ft (1,095 m) NAVD 88 |
| Prominence | 2,829 ft (862 m) |
| Listing | Oregon county high points |
| Geography | |
| Location | Polk County, Oregon, U.S. |
| Parent range | Central Oregon Coast Range |
| Topo map | USGS Laurel Mountain |
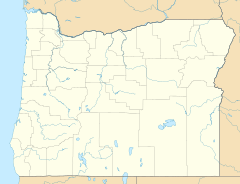
Laurel Mountain is a tall peak in Oregon, standing at 3,592 feet (1,095 m) high. It's the fourth highest mountain in Oregon's Central Coast Range. You can find it in Polk County, west of the city of Dallas.
This mountain is famous for how much rain it gets! In 1997, it was called the wettest place in Oregon. Even more amazing, in 1996, it set a record for the most rainfall in a single year in the entire United States. It received a huge 204.04 inches (5,182.6 mm) of rain that year!
Weather on Laurel Mountain
Laurel Mountain has a very wet and cool climate. It gets a lot of rain, especially from October to April. Even in the drier months of July and August, it's often foggy. This fog helps keep the ground and plants from getting too dry.
Rainfall Records
The mountain can get an incredible amount of rain. For example, in November 2006, it received over 49.59 inches (1,259.6 mm) of rain. Some days were so rainy that the rain gauges overflowed! In December 1996, which was a very wet month across the Pacific Northwest, Laurel Mountain got 49.57 inches (1,259.1 mm) of rain.
Temperatures and Snow
Even though winter temperatures are often above freezing during the day, Laurel Mountain gets a lot of snow because of all the rain. On average, about 9 inches (0.23 m) of snow covers the ground in January. The most snow ever recorded in one season was a massive 323.50 inches (8.22 m) between July 1998 and June 1999.
The temperatures on Laurel Mountain can vary a lot. Since 1978, the coldest it has been was −11 °F (−23.9 °C) on December 24, 1983. The hottest it has been was 94 °F (34.4 °C) on July 22, 2005.
| Climate data for Laurel Mountain, Oregon (1978–2013) | |||||||||||||
|---|---|---|---|---|---|---|---|---|---|---|---|---|---|
| Month | Jan | Feb | Mar | Apr | May | Jun | Jul | Aug | Sep | Oct | Nov | Dec | Year |
| Record high °F (°C) | 78 (26) |
68 (20) |
68 (20) |
76 (24) |
87 (31) |
90 (32) |
94 (34) |
92 (33) |
90 (32) |
85 (29) |
67 (19) |
74 (23) |
94 (34) |
| Mean daily maximum °F (°C) | 40.3 (4.6) |
39.9 (4.4) |
41.5 (5.3) |
45.3 (7.4) |
52.2 (11.2) |
57.7 (14.3) |
66.0 (18.9) |
67.5 (19.7) |
62.7 (17.1) |
53.5 (11.9) |
43.0 (6.1) |
39.9 (4.4) |
50.8 (10.4) |
| Mean daily minimum °F (°C) | 30.7 (−0.7) |
30.1 (−1.1) |
31.0 (−0.6) |
32.8 (0.4) |
37.4 (3.0) |
42.5 (5.8) |
48.8 (9.3) |
49.9 (9.9) |
46.9 (8.3) |
40.3 (4.6) |
33.3 (0.7) |
29.7 (−1.3) |
37.8 (3.2) |
| Record low °F (°C) | −1 (−18) |
−8 (−22) |
16 (−9) |
21 (−6) |
26 (−3) |
30 (−1) |
36 (2) |
36 (2) |
32 (0) |
19 (−7) |
8 (−13) |
−11 (−24) |
−11 (−24) |
| Average precipitation inches (mm) | 19.79 (503) |
14.54 (369) |
13.51 (343) |
9.20 (234) |
5.41 (137) |
3.68 (93) |
0.93 (24) |
1.39 (35) |
3.50 (89) |
9.03 (229) |
19.09 (485) |
20.83 (529) |
120.9 (3,070) |
| Average snowfall inches (cm) | 22.0 (56) |
23.6 (60) |
22.1 (56) |
16.8 (43) |
2.4 (6.1) |
0.0 (0.0) |
0.0 (0.0) |
0.0 (0.0) |
0.0 (0.0) |
0.6 (1.5) |
10.8 (27) |
23.8 (60) |
122.1 (309.6) |
| Average precipitation days (≥ 0.01 inch) | 18 | 15 | 18 | 15 | 12 | 9 | 4 | 4 | 7 | 12 | 18 | 18 | 150 |
| Source: WRCC | |||||||||||||


