Topographic map facts for kids
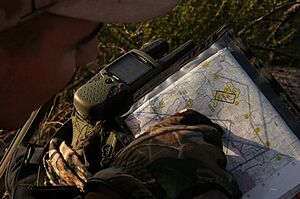
Sergeant Chris D. Washington checking his Topographic map during a morning deer hunt in Kilgore, Texas
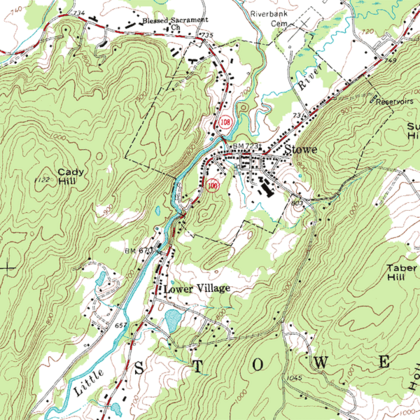
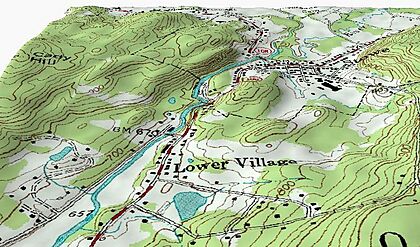
A topographic map of Stowe, Vermont with contour lines
|
Imagine you're exploring a new area. How would you know if you're walking uphill or downhill? That's where a topographic map comes in handy! These special maps show you the shape of the land, including mountains, valleys, and flat areas. They also display important features like rivers, roads, buildings, and forests.
Topographic maps are like a detailed picture of the Earth's surface. They use special lines called contour lines to show how high or low the land is. This helps you understand the terrain, whether you're planning a hike or just curious about your surroundings. These maps are very precise and cover specific areas in great detail.
Contents
What is a Topographic Map?
A topographic map is a detailed drawing of a part of the Earth. It shows both natural features, like mountains and rivers, and human-made things, like roads and towns. The most important thing about these maps is how they show the height of the land.
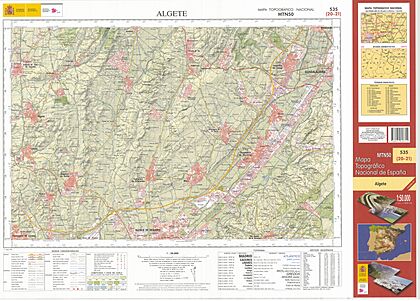
These maps use a system of lines and symbols to represent everything. They are often part of a larger map series. This means many map sheets fit together to show a whole region or country. Each map in a series follows the same rules for symbols and measurements.
How Topographic Maps Began
The idea of topographic maps started with detailed land surveys. These surveys measured many different heights and landforms. This was different from older maps that mainly showed property lines. The first full country map series was finished in France in 1789.
Later, large mapping projects like the Great Trigonometric Survey of India began in 1802. This project successfully measured the heights of huge mountains like the Himalayas. Early topographic maps were often made by the military. They used these maps to plan where to place defenses or move troops. Knowing the elevation of the land was very important for them.
From Paper to Digital Maps
Over time, topographic maps became important for countries to plan new roads, buildings, and manage resources. In the United States, the United States Geological Survey (USGS) took over national map-making in 1879.
Around 1913, an effort began to map the entire world at a scale of 1:1 million. This project, called the International Map of the World, created a useful system for indexing maps. Even though the full project wasn't completed, its indexing system is still used today.
By the 1980s, computers started changing how maps were made. Instead of printing many paper maps, information was stored in digital databases. This allowed people to create custom maps on their computers. For example, the US government created the TIGER database. This database stored information about borders, roads, and rivers.
Digital elevation models (DEM) also became available. These models showed the height of the land using data from maps, aerial photos, and satellites. These digital tools made geographic information systems (GIS) much more powerful. They also made Global Positioning System (GPS) devices much more useful by adding map context to location data. Today, you can find many maps online and on your phone, making it easier than ever to explore.
Why We Use Topographic Maps Today
Topographic maps are useful for many activities. They help people plan things like new buildings or parks. Scientists use them to study the Earth. Miners use them to find resources.
- Outdoor Adventures: Hikers, campers, and orienteering enthusiasts use them to navigate trails and understand the terrain.
- Planning: Engineers and city planners use them to design roads, bridges, and other structures.
- Education: Students learn about geography and landforms using these maps.
- Emergency Services: Firefighters and rescue teams use them to understand an area during emergencies.
Learning to read a topographic map takes practice. You need to understand how to find features and interpret the contour lines. Many groups, like scouts and the military, teach map reading skills.
Reading a Topographic Map
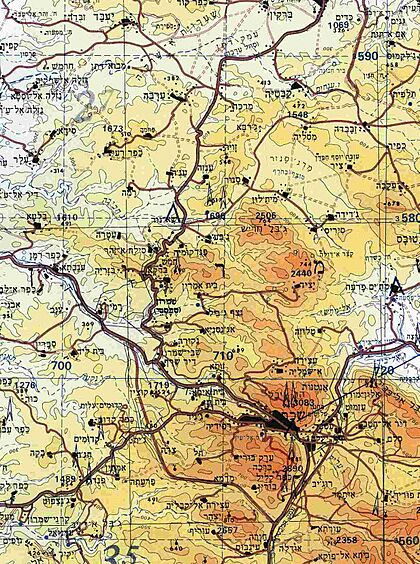
Topographic maps use special signs and symbols to show different features. For example, different colors might show different types of roads or land cover. These symbols are usually explained in a key or legend on the map itself.
In some places, like the United States, these maps are often called contour maps or topo maps. Because they are often organized into specific grid sections, they are also sometimes called quads.
Understanding Contour Lines
The most important feature on a topographic map is the contour line. These are lines that connect points of the same height above sea level. If you walk along a contour line, you would stay at the exact same elevation.
- Close lines: When contour lines are close together, it means the land is steep.
- Far apart lines: When they are far apart, the land is flatter.
- V-shapes: V-shaped contour lines often show valleys or streams. The point of the "V" usually points uphill.
These maps also show other important details. They mark streams, lakes, forests, and built-up areas. They can even show the direction that streams are flowing.
Symbols and Colors on Maps
Most topographic maps were created using aerial photography. This involves taking pictures from planes and then using special tools to turn them into maps. Today, new technologies like lidar (which uses lasers) and satellite data are also used. Older maps were made using traditional surveying tools on the ground.
The way topographic maps look can vary between different countries. Each country's mapping agency might have its own style for symbols and colors.
Who Makes These Maps?
Many countries have official organizations that create and publish topographic maps. These are often called national mapping agencies. While almost all of Earth's land has been mapped, some countries have much more detailed maps than others.
In the European Union, national mapping agencies must make their official maps available to the public. Some of these maps can even be used freely under licenses like Creative Commons.
See also
 In Spanish: Mapa topográfico para niños
- Aeronautical chart
- Bathymetric chart
- Cadastral map
- Thematic map
- Hypsometric tints
- International Map of the World
- (List of) national mapping agencies
- Nautical chart
- Raised-relief map
- Stereoplotter
- Topo (climbing)
- TopoFusion
- Topographic profile


