
Contour line facts for kids

A contour line is a special line on a map or diagram. It connects all the points that have the same value for something. Imagine you're looking at a map of a mountain. A contour line would connect all the places that are at the exact same height above sea level.
These lines are also called isopleths, isolines, isograms, or isarithms. The word "iso-" comes from Greek and means "equal". So, an isoline simply means a line connecting equal values.
When you see a contour map, it's a map that uses these lines to show how something changes across an area. For example, a map might show lines of equal temperature, equal pressure, or equal height.
The way these lines are drawn helps you understand the steepness of something. If the lines are very close together, it means the change is happening quickly, like a steep hill. If they are far apart, the change is slow, like a gentle slope.
Contour lines can be curved or straight. They show where a real or imagined surface meets a flat, horizontal level. By looking at these lines, you can guess how steep an area is and what the value might be at different spots. Sometimes, these lines are drawn by looking at 3D models. Other times, computers figure them out from many different measurement points.
Contents
What are the Different Types of Contour Lines?


Many different types of contour lines exist, depending on what they are measuring. Here are some common ones:
- Air pressure: isobars connect points of equal air pressure.
- Cloud cover: isonephs show areas with the same amount of cloud cover.
- Dew point: isodrosotherms connect points with the same dew point temperature.
- Height above sea level: These are simply called contour lines on a topographic map, or sometimes isohypses.
- Humidity: isohumes connect points with the same humidity.
- Rainfall: isohyets show areas that receive the same amount of rain.
- Ocean depth: isobaths connect points of equal water depth.
- Ocean saltiness: isohalines show areas with the same salt level in the ocean.
- Sound level: These are just called contour lines.
- Temperature: isotherms connect points with the same temperature.
- Time: isochrones show points that can be reached in the same amount of time (e.g., travel time).
- Wind speed: isotachs connect points with the same wind speed.
Sometimes, instead of "iso-", you might see "isallo-". This means the line connects points where something has changed at the same rate over a certain time.
How are Contour Maps Made?
To make contour maps easy to read, mapmakers choose how to draw the lines. They think about the line's thickness, color, style, and how numbers are added.
Line Thickness The thickness of a line depends on how much other information is on the map. If the map is mostly empty, the lines can be thicker. On many maps, like topographic maps, important lines (like every 100 feet of elevation) might be thicker or a different color than the smaller interval lines.
Line Color Mapmakers pick colors that make the contour lines stand out. Sometimes, they even use a shiny or glossy finish to make the lines more noticeable.
Line Style Lines can be solid, dashed, dotted, or broken in other ways. Dashed or dotted lines are often used when there's a lot of important information underneath the lines that needs to be seen clearly.
Adding Numbers Numbers are placed along some of the contour lines to show their exact value. You can then guess the values of the lines in between. The way these numbers are placed can also show you which way the slope is going (uphill or downhill). Sometimes, there's a map key that explains what each line value means.
Images for kids
-
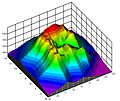
A three-dimensional surface, whose contour graph is below.
-
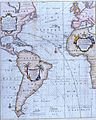
Edmond Halley's New and Correct Chart Shewing the Variations of the Compass (1701)
-
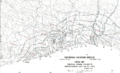
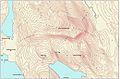
Isohyetal map of precipitation
-
Video loop of isallobars showing the motion of a cold front
-
Isogonic lines for the year 2000. The agonic lines are thicker and labeled with "0".
-
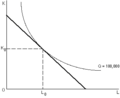
A single production isoquant (convex) and a single isocost curve (linear). Labor usage is plotted horizontally and physical capital usage is plotted vertically.
-
Contour map labeled aesthetically in an "elevation up" manner.


See also
 In Spanish: Isolínea para niños
