
Le Grand, California facts for kids
Quick facts for kids
Le Grand, California
|
|
|---|---|

Location in Merced County and the state of California
|
|

Le Grand, California
Location in the United States
|
|
| Country | |
| State | |
| County | Merced |
| Area | |
| • Total | 1.140 sq mi (2.953 km2) |
| • Land | 1.140 sq mi (2.953 km2) |
| • Water | 0 sq mi (0 km2) 0% |
| Elevation | 253 ft (77 m) |
| Population
(2020)
|
|
| • Total | 1,592 |
| • Density | 1,396.5/sq mi (539.11/km2) |
| Time zone | UTC-8 (Pacific) |
| • Summer (DST) | UTC-7 (PDT) |
| ZIP code |
95333
|
| Area code | 209 |
| FIPS code | 06-41040 |
| GNIS feature IDs | 277537, 2408590 |
Le Grand is a small community in Merced County, California. It is also known as a census-designated place (CDP). This means it is a place that the government counts for population, but it is not an official city.
Le Grand is about 14 miles (22.5 km) east of Merced. Merced is the main city of the county. Le Grand is located at an elevation of 253 feet (77 meters) above sea level. In 2020, about 1,592 people lived there. This number was a little lower than in 2010.
Contents
History of Le Grand
Le Grand got its first post office in 1896. The community was named after William Le Grand Dickinson. He sold land to the railroad company. This land was used to build the town. The railroad was first called the San Francisco and San Joaquin Valley Railroad. Later, it became part of the Atchison, Topeka and Santa Fe Railway.
Geography and Location
Le Grand is in the eastern part of Merced County. Its exact location is 37°13′43″N 120°14′54″W. The United States Census Bureau says that Le Grand covers about 1.1 square miles (2.9 square kilometers). All of this area is land. There are no large bodies of water within its boundaries.
Climate in Le Grand
Le Grand has a type of weather called a warm-summer Mediterranean climate. This means it has hot, dry summers and mild, wet winters. On climate maps, this is shown as "Csa".
| Climate data for Le Grand, California (1899–1980) | |||||||||||||
|---|---|---|---|---|---|---|---|---|---|---|---|---|---|
| Month | Jan | Feb | Mar | Apr | May | Jun | Jul | Aug | Sep | Oct | Nov | Dec | Year |
| Mean daily maximum °F (°C) | 55.1 (12.8) |
61.0 (16.1) |
66.1 (18.9) |
73.4 (23.0) |
82.2 (27.9) |
90.6 (32.6) |
97.8 (36.6) |
95.5 (35.3) |
89.4 (31.9) |
79.2 (26.2) |
66.0 (18.9) |
55.9 (13.3) |
76.0 (24.4) |
| Mean daily minimum °F (°C) | 35.8 (2.1) |
38.7 (3.7) |
40.2 (4.6) |
43.4 (6.3) |
49.0 (9.4) |
55.4 (13.0) |
60.5 (15.8) |
58.4 (14.7) |
54.2 (12.3) |
47.3 (8.5) |
39.2 (4.0) |
35.5 (1.9) |
46.5 (8.1) |
| Average precipitation inches (mm) | 2.35 (60) |
2.15 (55) |
1.99 (51) |
1.04 (26) |
0.39 (9.9) |
0.08 (2.0) |
0.01 (0.25) |
0.02 (0.51) |
0.19 (4.8) |
0.65 (17) |
1.38 (35) |
2.14 (54) |
12.40 (315) |
| Average snowfall inches (cm) | 0.1 (0.25) |
0.0 (0.0) |
0.0 (0.0) |
0.0 (0.0) |
0.0 (0.0) |
0.0 (0.0) |
0.0 (0.0) |
0.0 (0.0) |
0.0 (0.0) |
0.0 (0.0) |
0.0 (0.0) |
0.0 (0.0) |
0.1 (0.25) |
| Average precipitation days (≥ 0.01 in) | 7 | 7 | 6 | 3 | 2 | 1 | 0 | 0 | 1 | 2 | 4 | 6 | 39 |
| Source: WRCC | |||||||||||||
Population and People
| Historical population | |||
|---|---|---|---|
| Census | Pop. | %± | |
| U.S. Decennial Census | |||
The population of Le Grand has changed over the years. In 2010, there were 1,659 people living there. By 2020, the population had slightly decreased to 1,592 people.
Population in 2010
In 2010, the population density was about 1,455 people per square mile (562 people per square kilometer). Most people in Le Grand lived in family homes.
- Ethnic Background:
- About 52.4% of the people were White.
- About 1.1% were African American.
- About 2.1% were Native American.
- About 1.0% were Asian.
- About 0.1% were Pacific Islander.
- About 39.7% were from other ethnic groups.
- About 3.6% were from two or more ethnic groups.
- A large part of the population, about 81.8%, identified as Hispanic or Latino.
- Age Groups:
- About 32.2% of the people were under 18 years old.
- About 10.7% were between 18 and 24 years old.
- About 25.2% were between 25 and 44 years old.
- About 22.1% were between 45 and 64 years old.
- About 9.8% were 65 years or older.
The average age in Le Grand was 31.5 years.
- Homes:
There were 458 households in Le Grand. Many of these households, about 53.7%, had children under 18 living in them. Most households were married couples. About 68.8% of homes were owned by the people living in them. The rest, about 31.2%, were rented.
Images for kids
-
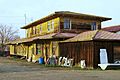
The former Le Grand station in 2008

See also
 In Spanish: Le Grand (California) para niños
