Limaville, Ohio facts for kids
Quick facts for kids
Limaville, Ohio
|
|
|---|---|

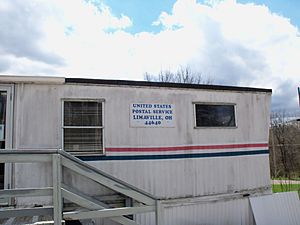
Limaville Post Office
|
|

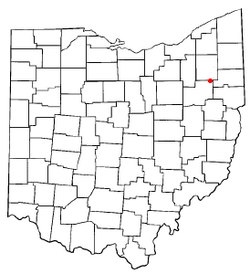
Location of Limaville, Ohio
|
|

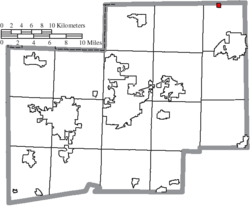
Location of Limaville in Stark County
|
|
| Country | United States |
| State | Ohio |
| County | Stark |
| Township | Lexington |
| Area | |
| • Total | 0.26 sq mi (0.68 km2) |
| • Land | 0.26 sq mi (0.66 km2) |
| • Water | 0.01 sq mi (0.01 km2) |
| Elevation | 1,086 ft (331 m) |
| Population
(2020)
|
|
| • Total | 151 |
| • Density | 589.84/sq mi (227.46/km2) |
| Time zone | UTC-5 (Eastern (EST)) |
| • Summer (DST) | UTC-4 (EDT) |
| ZIP code |
44640
|
| Area code(s) | 330 |
| FIPS code | 39-43596 |
| GNIS feature ID | 2804868 |
Limaville (/ˈlaɪməvɪl/ ly-MƏ-vil) is a small community in Stark County, Ohio, United States. It is known as a census-designated place (CDP). This means it's an area that the government counts for population. However, it does not have its own local government like a city or village. Limaville used to be a village.
In 2020, the population of Limaville was 151 people. It is part of the larger Canton–Massillon area.
Limaville's Location and Size
Limaville is located in the state of Ohio. It is found within Stark County. The community covers a total area of about 0.28 square miles (0.72 square kilometers).
Most of this area is land, about 0.27 square miles (0.70 square kilometers). A very small part, about 0.01 square miles (0.03 square kilometers), is water.
Who Lives in Limaville?
The study of who lives in a place is called demographics. This section shares information about the people in Limaville.
| Historical population | |||
|---|---|---|---|
| Census | Pop. | %± | |
| 1870 | 204 | — | |
| 1880 | 164 | −19.6% | |
| 1890 | 172 | 4.9% | |
| 1900 | 156 | −9.3% | |
| 1910 | 136 | −12.8% | |
| 1920 | 183 | 34.6% | |
| 1930 | 195 | 6.6% | |
| 1940 | 209 | 7.2% | |
| 1950 | 209 | 0.0% | |
| 1960 | 226 | 8.1% | |
| 1970 | 303 | 34.1% | |
| 1980 | 164 | −45.9% | |
| 1990 | 152 | −7.3% | |
| 2000 | 193 | 27.0% | |
| 2010 | 151 | −21.8% | |
| 2020 | 151 | 0.0% | |
| U.S. Decennial Census | |||
Population in 2010
In 2010, the census counted 151 people living in Limaville. There were 60 households and 44 families. A household is a group of people living together in one home.
The population density was about 559 people per square mile. This means that for every square mile of land, there were about 559 people.
Most of the people living in Limaville were White (98.0%). A smaller number were African American (2.0%). About 0.7% of the population identified as Hispanic or Latino.
Out of the 60 households, 35% had children under 18 living with them. More than half (53.3%) were married couples. About 10% of homes had a female head of household without a husband. Another 10% had a male head of household without a wife.
The average household had 2.52 people. The average family had 2.86 people.
The median age in Limaville was 42.2 years. This means half the people were older than 42.2, and half were younger. About 25.8% of residents were under 18 years old. About 20.5% were 65 years or older.
The community had slightly more males than females. About 52.3% of the population was male, and 47.7% was female.
See also
 In Spanish: Limaville (Ohio) para niños
 | Misty Copeland |
 | Raven Wilkinson |
 | Debra Austin |
 | Aesha Ash |

