Lime Springs, Iowa facts for kids
Quick facts for kids
Lime Springs, Iowa
|
|
|---|---|
 |
|
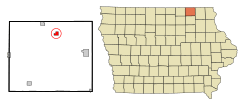
Location of Lime Springs, Iowa
|
|
| Country | United States |
| State | Iowa |
| County | Howard |
| Incorporated | April 17, 1876 |
| Area | |
| • Total | 1.01 sq mi (2.63 km2) |
| • Land | 1.01 sq mi (2.63 km2) |
| • Water | 0.00 sq mi (0.00 km2) |
| Elevation | 1,240 ft (378 m) |
| Population
(2020)
|
|
| • Total | 473 |
| • Density | 466.01/sq mi (179.92/km2) |
| Time zone | UTC-6 (Central (CST)) |
| • Summer (DST) | UTC-5 (CDT) |
| ZIP code |
52155
|
| Area code(s) | 563 |
| FIPS code | 19-45165 |
| GNIS feature ID | 0458350 |
Lime Springs is a small city located in Howard County, Iowa, in the United States. In 2020, about 473 people lived there. It's a quiet place with a rich history and a strong community spirit.
Contents
Discovering Lime Springs' History
The original settlement of Lime Springs was planned out in 1857. This first town was known as "Old Town."
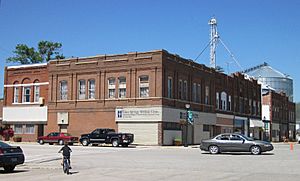
Later, when the railroad was built through the area, the town decided to move closer to the train tracks. This new location was planned in 1867 and was first called Lime Springs Station.
Exploring Lime Springs' Geography
Lime Springs is found at specific coordinates: 43.449578 degrees North and -92.281226 degrees West. You can see its exact spot on a map using these numbers.
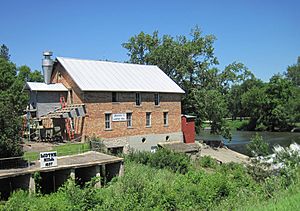
The town's center used to be a bit further north, near the Lidtke Mill on the Upper Iowa River. But it shifted south when the railroad arrived, making it easier for people and goods to travel.
According to the United States Census Bureau, the city covers about 1.02 square miles (2.63 square kilometers). All of this area is land, with no large bodies of water inside the city limits.
Climate in Lime Springs
Lime Springs experiences a range of weather throughout the year. Summers are warm, and winters can be very cold, with temperatures often dropping below freezing. The area gets a good amount of rain, especially in the spring and summer months.
| Climate data for Lime Springs, Iowa | |||||||||||||
|---|---|---|---|---|---|---|---|---|---|---|---|---|---|
| Month | Jan | Feb | Mar | Apr | May | Jun | Jul | Aug | Sep | Oct | Nov | Dec | Year |
| Record high °F (°C) | 59 (15) |
63 (17) |
83 (28) |
91 (33) |
93 (34) |
100 (38) |
102 (39) |
101 (38) |
98 (37) |
92 (33) |
75 (24) |
62 (17) |
102 (39) |
| Mean daily maximum °F (°C) | 23 (−5) |
28 (−2) |
41 (5) |
57 (14) |
69 (21) |
78 (26) |
82 (28) |
80 (27) |
72 (22) |
59 (15) |
42 (6) |
27 (−3) |
55 (13) |
| Daily mean °F (°C) | 14 (−10) |
19 (−7) |
31 (−1) |
45 (7) |
57 (14) |
67 (19) |
71 (22) |
69 (21) |
60 (16) |
47 (8) |
33 (1) |
19 (−7) |
44 (7) |
| Mean daily minimum °F (°C) | 5 (−15) |
9 (−13) |
21 (−6) |
33 (1) |
44 (7) |
55 (13) |
59 (15) |
57 (14) |
47 (8) |
35 (2) |
23 (−5) |
10 (−12) |
33 (1) |
| Record low °F (°C) | −35 (−37) |
−36 (−38) |
−29 (−34) |
−1 (−18) |
21 (−6) |
34 (1) |
40 (4) |
34 (1) |
24 (−4) |
10 (−12) |
−16 (−27) |
−30 (−34) |
−36 (−38) |
| Average precipitation inches (mm) | 1.0 (25) |
1.0 (25) |
1.9 (48) |
3.5 (89) |
4.1 (100) |
5.2 (130) |
4.5 (110) |
5.3 (130) |
3.8 (97) |
2.5 (64) |
2.1 (53) |
1.4 (36) |
36.3 (907) |
| Source: weather.com | |||||||||||||
People of Lime Springs: Demographics
The population of Lime Springs has changed over the years. Here's a quick look at how many people have lived there at different times:
| Historical populations | ||
|---|---|---|
| Year | Pop. | ±% |
| 1880 | 470 | — |
| 1890 | 550 | +17.0% |
| 1900 | 605 | +10.0% |
| 1910 | 498 | −17.7% |
| 1920 | 595 | +19.5% |
| 1930 | 539 | −9.4% |
| 1940 | 567 | +5.2% |
| 1950 | 551 | −2.8% |
| 1960 | 581 | +5.4% |
| 1970 | 497 | −14.5% |
| 1980 | 476 | −4.2% |
| 1990 | 438 | −8.0% |
| 2000 | 496 | +13.2% |
| 2010 | 505 | +1.8% |
| 2020 | 473 | −6.3% |
| Source: and Iowa Data Center Source: |
||
2020 Census Snapshot
In 2020, the census counted 473 people living in Lime Springs. There were 220 households, which are groups of people living together in one home.
Most residents, about 88.2%, identified as White. Other groups included Native American, Asian, and people of two or more races. About 7.6% of the population was Hispanic or Latino.
The average age in the city was about 41.9 years old. About 23.3% of the people were under 20 years old. The population was almost evenly split between males (49.3%) and females (50.7%).
Fun and Culture in Lime Springs
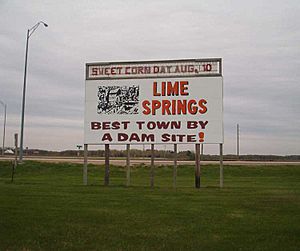
Lime Springs is known for its annual "Sweet Corn Days" festival. This exciting event happens on the second Sunday in August. The fun begins on Thursday and lasts all the way through Sunday!
During Sweet Corn Days, you can enjoy many activities. There are tractor pulls, softball games, and lots of things for families to do. Brown Park is a great spot for kids' activities.
Evenings feature live music and a street dance, perfect for enjoying with friends and family. On Sunday, everyone gets to enjoy free sweet corn and watch a lively parade. Keep an eye out for "Rocky the Raccoon," the festival's mascot, who decorates many windows around town!
Another popular place to visit is the historic Lidtke Mill. This old mill has been turned into a museum, where you can learn about the area's past.
Education in Lime Springs
Public schools in Lime Springs are part of the Howard–Winneshiek Community School District. This school district was created in 1960 by combining several smaller school districts.
In 2015, the school board made the decision to close the Lime Springs-Chester Elementary School. Students now attend other schools within the district.
See also
 In Spanish: Lime Springs (Iowa) para niños
 | Jackie Robinson |
 | Jack Johnson |
 | Althea Gibson |
 | Arthur Ashe |
 | Muhammad Ali |


