kids encyclopedia robot

Local government in Scotland facts for kids

Kids Encyclopedia Facts

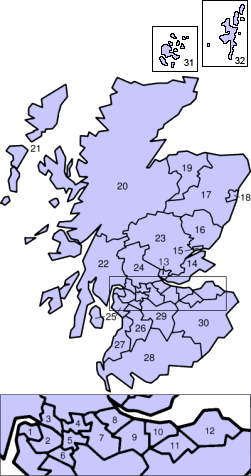
Local government in Scotland is organised through 32 unitary authorities designated as Councils which consist of councillors elected every five years by registered voters in each of the council areas.

Councils receive the majority of their funding from the Scottish Government, through Aggregate External Finance (AEF). AEF consists of three parts: Revenue Support Grants, Non-Domestic Rates, and Income and Specific Grants. The level of central government support for each authority is determined by the Cabinet Secretary for Finance and Sustainable Growth, currently Derek Mackay MSP, and is distributed by the Finance and Central Services Department of the Scottish Government. Councils obtain additional income through the Council Tax, that the council itself sets.

Scottish councils co-operate through, and are represented collectively by, the Convention of Scottish Local Authorities (COSLA).

History

Origins

The history of Scottish local government mainly surrounds involves the counties of Scotland. The counties have their origins in the sheriffdoms or shires over which a sheriff (a contraction of shire reeve) exercised jurisdiction.

Malcolm III appears to have introduced sheriffs as part of a policy of replacing native "Celtic" forms of government with Anglo Saxon and Norman feudal structures. This was continued by his sons Edgar, Alexander I and in particular David I. David completed the division of the country into sheriffdoms by the conversion of existing thanedoms.

From the seventeenth century the shires started to be used for local administration apart from judicial functions. In 1667 Commissioners of Supply were appointed in each sheriffdom to collect the land tax. The commissioners eventually assumed other duties in the county. In 1858 police forces were established in each county under the Police (Scotland) Act 1857.

As a result of the dual system of local government, burghs (of which there were various types) often had a high degree of autonomy.

Modern history

Between 1890 and 1975 local government in Scotland was organised with county councils (including four counties of cities) and various lower-level units. Between 1890 and 1929, there were parish councils and town councils, but with the passing of the Local Government (Scotland) Act 1929, the functions of parish councils were passed to larger district councils and a distinction was made between large burghs (i.e. those with a population of 20,000 or more) and small burghs. This system was further refined by the passing of the Local Government (Scotland) Act 1947.

In 1975, legislation passed by the Conservative government of Edward Heath (1970–1974) introduced a system of two-tier local government in Scotland (see Local government areas of Scotland 1973 to 1996), divided between large Regional Councils and smaller District Councils. The only exceptions to this were the three Island Councils, Western Isles, Shetland and Orkney which had the combined powers of Regions and Districts. The Conservative government of John Major (1990–1997) decided to abolish this system and merge their powers into new unitary authorities. The new councils vary widely in size — some are the same as counties, such as Clackmannanshire, some are the same as former districts, such as Inverclyde and some are the same as the former regions, such as Highland. The changes took effect in 1996 with shadow councillors elected in 1995 to oversee the smooth transition of control.

Map

ScotlandLabelled.png
2

Election results, 2012

[discuss] – [edit]
Summary of the 3 May 2012 Scottish council election results
Party First-preference votes Seats won
# % Swing (pp) # Net Gain %
Scottish National Party 503,233 32.33 +4.48 425 +62 34.75
Labour 488,703 31.39 +3.26 394 +46 32.22
Conservative 206,599 13.27 −2.35 115 −28 9.40
Independents 183,329 11.78 +1.27 196 +12 16.03
Liberal Democrats 103,087 6.62 -6.05 71 -95 5.81
Green 36,000 2.31 +0.11 14 +6 1.14
UKIP 4,289 0.28 +0.22 0 ±0 0.00
Scottish Socialist Party 4,183 0.27 −0.61 1 ±0 0.08
Borders Party 3,755 0.24 +0.12 2 ±0 0.16
Action to Save St John's Hospital 3,474 0.22 +0.03 0 −3 0.00
East Dunbartonshire Independent Alliance 2,973 0.19 −0.09 2 ±0 0.16
style="background-color:Template:Glasgow First/meta/color"| Glasgow First 2,547 0.16 +0.16 1 +1 0.08
Trade Unionist and Socialist Coalition 2,485 0.16 +0.16 0 ±0 0.00
style="background-color:Template:Scottish Christian Party/meta/color"| Christian Party 2,344 0.15 +0.12 0 ±0 0.00
style="background-color:Template:Scottish Senior Citizens Unity Party/meta/color"| All Scotland Pensioners Party 2,328 0.15 +0.08 0 ±0 0.00
Cumbernauld Independent Alliance 1,894 0.12 +0.02 1 ±0 0.08
style="background-color:Template:Scottish Unionist Party (1986)/meta/color"| Unionist 864 0.06 −0.09 0 ±0 0.00
Perth Independent Candidates 805 0.05 +0.05 1 +1 0.08
Solidarity 787 0.05 −0.81 0 −1 0.00
Socialist Labour Party 714 0.05 +0.03 0 ±0 0.00
East Kilbride Alliance 681 0.04 −0.03 0 ±0 0.00
Liberal 595 0.04 −0.02 0 ±0 0.00
National Front 369 0.02 +0.02 0 ±0 0.00
Pirate Party 292 0.02 +0.02 0 ±0 0.00
style="background-color:Template:Christian Peoples Alliance/meta/color"| Christian Peoples Alliance 209 0.01 +0.01 0 ±0 0.00
style="background-color:Template:Communist Party of Britain/meta/color"| Communist Party of Britain 94 <0.01 +0.01 0 ±0 0.00
Britannica 73 <0.01 0 ±0 0.00
Official Monster Raving Loony Party 67 <0.01 0 ±0 0.00
Total 1,556,773 100.00 ±0.00 1,223 +1 100.00

Election results, 2007

Follow the introduction of the Local Governance (Scotland) Act 2004 local elections are held using the single transferable vote, with this taking place for the first time in 2007. This change in voting system saw all but five councils end up with no one party in control. Labour retained control of the City of Glasgow and North Lanarkshire, while Orkney, Shetland and Na h-Eileanan Siar continue to be controlled by Independent councillors.

The results are summarised below. Further analysis can be found on the page Scottish council elections, 2007

style="width: 2px; background-color: #E4003B;" data-sort-value="Scottish Labour Party" | style="width: 2px; background-color: #FDF38E;" data-sort-value="Scottish National Party" | style="width: 2px; background-color: #0087DC;" data-sort-value="Scottish Conservative Party" | style="width: 2px; background-color: #FAA61A;" data-sort-value="Scottish Liberal Democrats" | style="width: 2px; background-color: #DDDDDD;" data-sort-value="Independent politician" |

[discuss] – [edit]
Summary of the 3 May 2007 Scottish council election results
Parties First-Preference
Votes
Votes % +/- Councillors Net
Gain/Loss
Labour 590,085 28.1 −4.5% 348 −161
SNP 585,885 27.9 +3.8% 363 +182
Conservative 327,591 15.6 +0.5% 143 +21
Liberal Democrats 266,693 12.7 −1.8% 166 −9
Independent 228,894 10.9 +0.8% 192 −38
Other 102,897 4.9 +1.3% 10 +6
Total 2,099,945 1,222

Council control

The 32 unitary authorities are controlled as follows. The figures incorporate the results from the 2007 local government election, plus gains and losses from subsequent local by-elections, and party defections.

Council area Political control Lab SNP LD Con Grn Oth Total
City of Aberdeen LD-SNP 10 13 15 4 0 1 43
Aberdeenshire SNP 2 28 12 14 1 11 68
Angus Con-LD-Lab-Oth 2 13 3 5 0 6 29
Argyll and Bute Oth-LD-Con 0 10 8 3 0 15 36
Clackmannanshire Lab (minority) 8 8 0 1 0 1 18
Dumfries and Galloway Con-LD (minority) 14 10 3 18 0 2 47
City of Dundee SNP (minority) 8 14 2 3 0 2 29
East Ayrshire SNP (minority) 14 14 0 3 0 1 32
East Dunbartonshire Con-Lab (minority) 6 8 3 5 0 2 24
East Lothian SNP-LD 7 7 6 2 0 1 23
East Renfrewshire Lab-SNP-Oth-LD 7 3 1 7 0 2 20
City of Edinburgh LD-SNP 15 12 17 11 3 0 58
Comhairle nan Eilean Siar (Outer Hebrides) Ind 2 4 0 0 0 25 31
Falkirk Lab-Oth-Con 14 13 0 2 0 3 32
Fife SNP-LD 24 23 21 5 0 5 78
City of Glasgow Lab 46 22 5 1 5 0 79
Highland Oth-LD-Lab 7 18 21 0 0 34 80
Inverclyde Lab-Con-Oth 9 5 4 1 0 1 20
Midlothian Lab (minority) 9 6 3 0 0 0 18
Moray Oth-Con 2 9 0 3 0 12 26
North Ayrshire Lab (minority) 12 8 2 3 0 5 30
North Lanarkshire Lab 40 23 1 1 0 5 70
Orkney Oth 0 0 0 0 0 21 21
Perth and Kinross SNP-LD 3 18 8 12 0 0 41
Renfrewshire SNP-LD 17 17 4 2 0 0 40
Scottish Borders Oth-Con-LD 0 6 10 11 0 7 34
Shetland Oth 0 0 0 0 0 22 22
South Ayrshire Con (minority) 9 8 0 12 0 1 30
South Lanarkshire Lab-Con-LD 30 24 2 8 0 3 67
Stirling Lab-Con 8 9 0 4 0 1 22
West Dunbartonshire SNP-Oth 10 9 0 0 0 3 22
West Lothian SNP-Oth 14 13 0 1 0 4 32
TOTAL - 348 363 166 143 8 194 1222

Community councils

Community councils represent the interests of local people. Local authorities have a statutory duty to consult community councils on planning, development and other issues directly affecting that local community. However, the community council has no direct say in the delivery of services. In many areas they do not function at all, but some work very effectively at improving their local area. Elections for community councils are determined by the local authority but the law does state that candidates cannot stand on a party-political ticket.

kids search engine
Local government in Scotland Facts for Kids. Kiddle Encyclopedia.