Lyford, Texas facts for kids
Quick facts for kids
Lyford, Texas
|
|
|---|---|

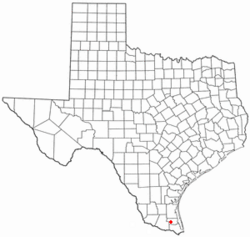
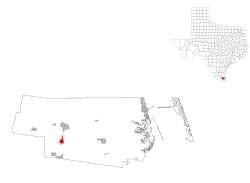
Location of Lyford, Texas
|
|
 |
|
| Country | United States |
| State | Texas |
| County | Willacy |
| Area | |
| • Total | 1.81 sq mi (4.68 km2) |
| • Land | 1.75 sq mi (4.52 km2) |
| • Water | 0.06 sq mi (0.16 km2) |
| Elevation | 33 ft (10 m) |
| Population
(2020)
|
|
| • Total | 2,249 |
| • Density | 1,243/sq mi (480.6/km2) |
| Time zone | UTC-6 (Central (CST)) |
| • Summer (DST) | UTC-5 (CDT) |
| ZIP code |
78569
|
| Area code(s) | 956 |
| FIPS code | 48-45228 |
| GNIS feature ID | 1340749 |
Lyford is a small city located in Willacy County, Texas, in the United States. In 2020, about 2,249 people lived there. It is part of a larger area that includes cities like Brownsville and Harlingen. Lyford is also close to the border with Mexico.
Contents
Where is Lyford Located?
Lyford is found at specific map coordinates: 26°24'40" North and 97°47'24" West. This helps pinpoint its exact location on a global map.
In 2000, the city covered about 1.1 square miles (2.8 square kilometers). Most of this area was land, with a very small amount of water. Before the 2010 census, Lyford grew bigger by adding nearby areas called Bausell and Ellis, and part of Lyford South. This made the city's total size increase to about 1.8 square miles (4.7 square kilometers). Now, about 1.7 square miles (4.4 square kilometers) is land, and 0.1 square miles (0.26 square kilometers) is water.
How Many People Live in Lyford?
| Historical population | |||
|---|---|---|---|
| Census | Pop. | %± | |
| 1930 | 795 | — | |
| 1940 | 891 | 12.1% | |
| 1950 | 1,473 | 65.3% | |
| 1960 | 1,554 | 5.5% | |
| 1970 | 1,425 | −8.3% | |
| 1980 | 1,618 | 13.5% | |
| 1990 | 1,674 | 3.5% | |
| 2000 | 1,973 | 17.9% | |
| 2010 | 2,611 | 32.3% | |
| 2020 | 2,249 | −13.9% | |
| U.S. Decennial Census 1850–1900 1910 1920 1930 1940 1950 1960 1970 1980 1990 2000 2010 |
|||
The table above shows how Lyford's population has changed over many years. You can see how the number of people living in the city has grown and shrunk at different times.
Lyford's Population in 2020
In 2020, the 2020 United States census counted 2,249 people living in Lyford. These people lived in 656 households, which are like homes where people live together. Out of these, 529 were families.
The people living in Lyford come from different backgrounds:
| Race | Number | Percentage |
|---|---|---|
| White (NH) | 68 | 3.02% |
| Black or African American (NH) | 20 | 0.89% |
| Native American or Alaska Native (NH) | 4 | 0.18% |
| Asian (NH) | 3 | 0.13% |
| Some Other Race (NH) | 1 | 0.04% |
| Mixed/Multi-Racial (NH) | 3 | 0.13% |
| Hispanic or Latino | 2,150 | 95.6% |
| Total | 2,249 |
Most of the people in Lyford, about 95.6%, are of Hispanic or Latino background. There are also smaller numbers of people from other racial groups.
Education in Lyford
The public schools in Lyford are managed by the Lyford Consolidated Independent School District. This district is responsible for providing education to the children and teens in the area.
Lyford's Economy
Lyford's economy has changed a lot since January 1, 1994. This was when the North American Free Trade Agreement (NAFTA) started. Before NAFTA, most of the money in Lyford came from farming. After NAFTA, the economy became more varied. For example, a second convenience store opened, showing new types of businesses.
Besides industrial activities, Lyford also has many shops. These shops depend on customers from Mexico, especially from cities like Monterrey and Tampico. These Mexican shoppers, who are often wealthy or middle-class, spend a lot of money in the area. According to experts, Mexican shoppers have invested a lot of money and helped create many jobs in the region. In 2003, sales in the Rio Grande Valley, where Lyford is located, increased significantly, reaching over $10 billion.
See also
 In Spanish: Lyford (Texas) para niños
 | Stephanie Wilson |
 | Charles Bolden |
 | Ronald McNair |
 | Frederick D. Gregory |

