Lynnville, Illinois facts for kids
Quick facts for kids
Lynnville, Illinois
|
|
|---|---|
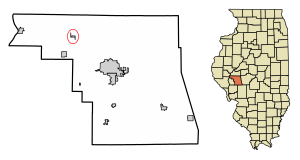
Location in Morgan County, Illinois
|
|
| Country | United States |
| State | Illinois |
| County | Morgan |
| Area | |
| • Total | 0.08 sq mi (0.20 km2) |
| • Land | 0.08 sq mi (0.20 km2) |
| • Water | 0.00 sq mi (0.00 km2) |
| Elevation | 620 ft (190 m) |
| Population
(2020)
|
|
| • Total | 96 |
| • Density | 1,246.75/sq mi (479.22/km2) |
| Time zone | UTC-6 (CST) |
| • Summer (DST) | UTC-5 (CDT) |
| ZIP code |
62650
|
| Area code(s) | 217 |
| FIPS code | 17-45369 |
| GNIS feature ID | 2399209 |
| Wikimedia Commons | Lynnville, Illinois |
Lynnville is a small village located in Morgan County, Illinois, United States. In 2020, about 96 people lived there. It is part of the larger Jacksonville area.
Contents
Exploring Lynnville's Location
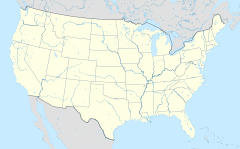
Lynnville is found in the western part of Morgan County. It is about 8 miles (13 km) west-southwest of Jacksonville. Jacksonville is the main city and county seat for the area.
How Big is Lynnville?
According to the U.S. Census Bureau, Lynnville covers a total area of about 0.08 square miles (0.20 square kilometers). All of this area is land. There are no large bodies of water within the village limits.
Roads Near Lynnville
Interstate 72 and U.S. Route 36 pass about half a mile (0.8 km) south of the village. However, there is no direct exit or entrance to these highways from Lynnville. An older path of U.S. Route 36 runs the same distance north of the village.
Understanding Lynnville's Population
The number of people living in Lynnville has changed over the years. Here is a look at the population from 1900 to 2020:
| Historical population | |||
|---|---|---|---|
| Census | Pop. | %± | |
| 1900 | 176 | — | |
| 1910 | 94 | −46.6% | |
| 1920 | 123 | 30.9% | |
| 1930 | 97 | −21.1% | |
| 1940 | 108 | 11.3% | |
| 1950 | 101 | −6.5% | |
| 1960 | 97 | −4.0% | |
| 1970 | 125 | 28.9% | |
| 1980 | 159 | 27.2% | |
| 1990 | 125 | −21.4% | |
| 2000 | 137 | 9.6% | |
| 2010 | 117 | −14.6% | |
| 2020 | 96 | −17.9% | |
| U.S. Decennial Census | |||
People and Homes in 2000
In the year 2000, there were 137 people living in Lynnville. These people lived in 55 households, and 38 of these were families. The village had about 1,737 people per square mile. There were 57 housing units in total.
Most of the people in Lynnville were White (99.27%). A small number (0.73%) were Native American. Also, 0.73% of the population identified as Hispanic or Latino.
Household Life in Lynnville
Out of the 55 households, about 29.1% had children under 18 living with them. More than half (54.5%) were married couples living together. About 7.3% of households had a female head with no husband present. Around 25.5% of all households were made up of single individuals. About 14.5% of households had someone aged 65 or older living alone.
The average household had about 2.49 people. The average family size was about 3.03 people.
Age Groups in the Village
The population in Lynnville was spread across different age groups. About 21.9% of the people were under 18 years old. About 13.9% were between 18 and 24. The largest group, 26.3%, was between 25 and 44 years old. About 24.1% were between 45 and 64, and 13.9% were 65 or older. The average age in the village was 34 years.
For every 100 females, there were about 107.6 males. If we only look at adults aged 18 and over, there were about 114 males for every 100 females.
Money Matters in Lynnville
In 2000, the average income for a household in Lynnville was $38,000 per year. For families, the average income was $40,313. Men earned about $19,375 on average, while women earned about $21,500. The per capita income (income per person) for the village was $14,919.
Very few people in Lynnville lived below the poverty line. No families were below it, and only 1.4% of the total population. This included no children under 18 and no seniors over 64.
See also
 In Spanish: Lynnville (Illinois) para niños
 | Madam C. J. Walker |
 | Janet Emerson Bashen |
 | Annie Turnbo Malone |
 | Maggie L. Walker |


