
Marbach, Lucerne facts for kids
Quick facts for kids
Marbach
|
||
|---|---|---|
|
||

Marbach
Location in Switzerland

Marbach
Location in Canton of Lucerne
|
||
| Country | Switzerland | |
| Canton | Lucerne | |
| District | Entlebuch | |
| Area | ||
| • Total | 45.10 km2 (17.41 sq mi) | |
| Elevation | 871 m (2,858 ft) | |
| Population
(Dec 2011)
|
||
| • Total | 1,217 | |
| • Density | 26.984/km2 (69.89/sq mi) | |
| Postal code |
6196
|
|
| Surrounded by | Eggiwil (BE), Escholzmatt, Flühli, Schangnau (BE), Trub (BE) | |

Marbach was once a small town, also known as a municipality, located in the Entlebuch district. This area is part of the canton of Lucerne in Switzerland. On January 1, 2013, Marbach joined with another town called Escholzmatt. Together, they formed a new, larger municipality known as Escholzmatt-Marbach.
Contents
Marbach's Past: A Brief History
Marbach is quite old! The first time anyone wrote about Marbach was in the year 1306. Back then, it was called Marpach.
Exploring Marbach's Geography
Marbach covered an area of about 45.1 square kilometers (which is about 17.4 square miles). A big part of this land, almost half (45.3%), was used for farming. Another large portion (47.4%) was covered by forests.
The rest of the land was used for buildings and roads (2.6%). A small part (4.7%) was made up of natural features like rivers or mountains. In 1997, surveys showed that forests covered nearly 47.4% of the land. Most of the farming land (45.1%) was used for crops or pastures.
The settled areas included buildings (1.04%), industrial zones (0.07%), and roads for transport (1.11%). The non-productive areas included rivers (0.86%) and other natural land (3.88%). Marbach is located in the southwest part of the Lucerne canton.
Who Lives in Marbach: Demographics
In 2011, Marbach had a population of 1,217 people. A small number, about 1.7%, were people from other countries in 2007. Over the ten years before 2011, the number of people living in Marbach went down by about 11.5%.
Most people in Marbach (97.8% in 2000) spoke German. Portuguese was the second most common language (0.6%), followed by Serbo-Croatian (0.4%).
Political Choices
In the 2007 election, the most popular political group was the CVP. They received 55% of the votes. Other popular parties included the FDP (20.5%), the SVP (19.7%), and the SPS (2.4%).
Age Groups in Marbach
The population of Marbach had different age groups. About 21.3% of the people (254 individuals) were aged 0–19 years. Young adults, aged 20–39, made up 25.4% (303 people). The largest group, 34.9% (416 people), were aged 40–64.
Older adults, aged 65–79, were 14% of the population (167 people). Those aged 80–89 were 3.8% (45 people). A very small group, 0.7% (8 people), were 90 years old or older.
Education and Learning
People in Switzerland generally have a good education. In Marbach, about 52.4% of adults aged 25-64 had finished higher education. This means they either went to a non-mandatory upper secondary school or a university.
Homes and Households
In 2000, there were 444 households in Marbach. About 30.2% (134 households) had only one person living in them. There were also 59 large households (13.3%) with five or more family members.
The town had 321 inhabited buildings in 2000. Of these, 162 were only for living, and 159 were mixed-use buildings. Most homes were either two (107) or three (43) stories tall.
Jobs and Work
Marbach had a low unemployment rate of 0.65%. In 2005, many people worked in the primary economic sector, which includes farming. There were 278 people and 108 businesses in this area.
The secondary sector, which includes manufacturing, employed 51 people in 12 businesses. The tertiary sector, which covers services like shops and offices, had 179 people working in 33 businesses. In 2000, nearly half (49.5%) of the people in Marbach had jobs. Women made up 37.1% of the working population.
Religious Beliefs
In the 2000 census, most people in Marbach were Christian. About 73.1% (859 people) were Roman Catholic. Another 20.3% (238 people) were Protestant. A small number (0.09%) belonged to other Christian faiths.
There were also 8 people (0.68%) who were Muslim. A few people (0.43%) belonged to other religions. Some people (1.11%) did not belong to any organized religion, and 4.34% did not answer the question.
Population Over Time
Here's how Marbach's population has changed over the years:
| year | population |
|---|---|
| 1850 | 1,850 |
| 1900 | 1,491 |
| 1950 | 1,402 |
| 2000 | 1,175 |
Marbach's Weather
Marbach experiences an average of 162.3 rainy days each year. On average, it receives about 1760 millimeters (or 69.3 inches) of rain. June is the wettest month, with an average of 218 millimeters (8.6 inches) of rain over 16.4 days.
May has the most days with rain, averaging 16.9 days, but with slightly less rain (179 millimeters or 7 inches). February is the driest month, with about 112 millimeters (4.4 inches) of rain over 16.4 days.
Gallery
-
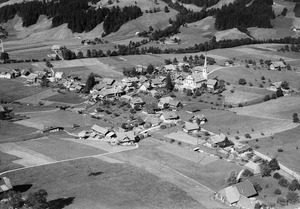
Marbach, Entlebuch
-
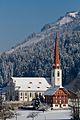
Church
-
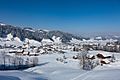
Centre of Marbach
-
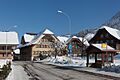
Marbachegg


See also
 In Spanish: Marbach (Lucerna) para niños
