Marshallville, Georgia facts for kids
Quick facts for kids
Marshallville, Georgia
|
|
|---|---|

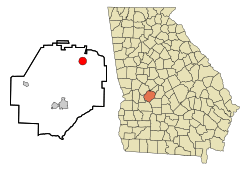
Location in Macon County and the state of Georgia
|
|
| Country | United States |
| State | Georgia |
| County | Macon |
| Area | |
| • Total | 3.16 sq mi (8.18 km2) |
| • Land | 3.12 sq mi (8.09 km2) |
| • Water | 0.03 sq mi (0.08 km2) |
| Elevation | 515 ft (157 m) |
| Population
(2020)
|
|
| • Total | 1,048 |
| • Density | 335.47/sq mi (129.52/km2) |
| Time zone | UTC-5 (Eastern (EST)) |
| • Summer (DST) | UTC-4 (EDT) |
| ZIP code |
31057
|
| Area code(s) | 478 |
| FIPS code | 13-49924 |
| GNIS feature ID | 0356378 |
Marshallville is a small city located in Macon County, Georgia, in the United States. In 2020, about 1,048 people lived there. This number was a bit lower than in 2010, when 1,448 people called Marshallville home.
Contents
History
Marshallville began as a settlement in the 1820s. It officially became a town in 1854. Later, in 1953, it was recognized as a city.
Geography
Marshallville is found in the northeast part of Macon County. Two main roads, Georgia State Route 49 and Georgia State Route 127, go through the city.
Route 49 travels southwest for about 13 miles to Montezuma, which is the biggest city in the county. If you go north on Route 49, you'll reach Fort Valley in about 8 miles.
Route 127 also starts by going southwest with Route 49. Then it turns west, leading about 21 miles to Rupert. If you head east on Route 127, you'll get to Perry in about 13 miles.
The city covers a total area of about 3.2 square miles (8.3 square kilometers). Most of this area is land, with only a tiny part, about 0.03 square miles (0.08 square kilometers), being water.
Who Lives Here?
| Historical population | |||
|---|---|---|---|
| Census | Pop. | %± | |
| 1870 | 424 | — | |
| 1880 | 543 | 28.1% | |
| 1890 | 1,086 | 100.0% | |
| 1900 | 879 | −19.1% | |
| 1910 | 1,082 | 23.1% | |
| 1920 | 1,150 | 6.3% | |
| 1930 | 931 | −19.0% | |
| 1940 | 905 | −2.8% | |
| 1950 | 1,121 | 23.9% | |
| 1960 | 1,308 | 16.7% | |
| 1970 | 1,376 | 5.2% | |
| 1980 | 1,540 | 11.9% | |
| 1990 | 1,457 | −5.4% | |
| 2000 | 1,335 | −8.4% | |
| 2010 | 1,448 | 8.5% | |
| 2020 | 1,048 | −27.6% | |
| U.S. Decennial Census 1850-1870 1870-1880 1890-1910 1920-1930 1940 1950 1960 1970 1980 1990 2000 2010 |
|||
The table below shows the different groups of people living in Marshallville as of the 2020 census.
| Race | Num. | Perc. |
|---|---|---|
| White (non-Hispanic) | 200 | 19.08% |
| Black or African American (non-Hispanic) | 814 | 77.67% |
| Native American | 1 | 0.1% |
| Asian | 1 | 0.1% |
| Pacific Islander | 1 | 0.1% |
| Other/Mixed | 17 | 1.62% |
| Hispanic or Latino | 14 | 1.34% |
In 2020, Marshallville had 1,048 people living there. These people made up 560 households, and 309 of these were families.
See also
 In Spanish: Marshallville (Georgia) para niños
 | Janet Taylor Pickett |
 | Synthia Saint James |
 | Howardena Pindell |
 | Faith Ringgold |

