Mayo, Yukon facts for kids
Quick facts for kids
Mayo
|
|
|---|---|
| Village of Mayo | |

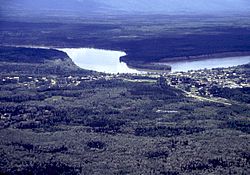
Mayo upon Stewart River, circa 2000
|
|
| Country | Canada |
| Territory | Yukon |
| Established | 1903 |
| Area
(2021)
|
|
| • Land | 0.98 km2 (0.38 sq mi) |
| Population
(2021)
|
|
| • Total | 188 |
| • Density | 191.8/km2 (497/sq mi) |
| Time zone | UTC−07:00 (MST) |
| Forward sortation area |
Y0B 1M0
|
| Area code(s) | 867 |
Mayo is a small village in Yukon, Canada. It is located along the Silver Trail and the Stewart River. In 2021, about 188 people lived there.
Mayo is also the home of the First Nation of Na-Cho Nyak Dun. These are Indigenous people who speak a northern type of the Tutchone language. The name Na-Cho Nyäk Dun means "big river people."
The community used to be called Mayo Landing. It has its own airport, Mayo Airport. The village was named after Alfred Mayo, who was once a circus acrobat. He later became a settler and explorer in the area.
Mayo has one school called J.V. Clark School. It is named after James Vincent Clark. In late 2022, the school had 46 students.
Contents
History of Mayo
Early Life of the Na-Cho Nyäk Dun People
Before Europeans arrived, the Na-Cho Nyäk Dun people lived in this area. They had two communities and lived by hunting and trapping animals. The river we now call the Stewart River was known as "Náhcho Nyäk," meaning 'Great River.'
The people lived across the Stewart River from where Mayo is today. This old area is still called "Old Mayo village." A missionary helped to rebuild the old settlement. However, in 1934, the river flooded badly. It destroyed much of the old village, including the church and many important cultural items.
Gold and Silver Discoveries
The first gold was found in the Mayo area in the 1880s. Silver was also discovered later on. For a long time, Mayo could only be reached by river. All supplies came by boat.
In the 1950s, new roads were built. The Klondike Highway and the Silver Trail connected Mayo to Stewart Crossing. This made it much easier to travel to and from the village.
Land Rights and Agreements
From 1973 to 1984, leaders of the Northern Tutchone people talked with the government. They discussed land rights and how they could govern themselves. A big step forward happened in 1993. A special agreement was made about a large area of land, about 4,739 square kilometers. The agreement also included a payment of C$14.5 million over fifteen years.
Mayo has also worked with the Trʼondëk Hwëchʼin First Nation. They made a deal with Yukon Energy to provide electricity to Dawson City. This is done using the Mayo-Dawson Power Line.
In 2008, an agreement was made with Alexco Resource Corp. This company extracts silver from the Keno Hill Silver area. This area is near Mayo Lake, about 45 kilometers northeast of Mayo. The company runs about 40 silver mines there.
Population of Mayo
How Many People Live Here?
| Federal census population history of Mayo | ||
|---|---|---|
| Year | Pop. | ±% |
| 1951 | 241 | — |
| 1956 | 249 | +3.3% |
| 1961 | 342 | +37.3% |
| 1966 | 479 | +40.1% |
| 1971 | 381 | −20.5% |
| 1976 | 448 | +17.6% |
| 1981 | 398 | −11.2% |
| 1986 | 317 | −20.4% |
| 1991 | 243 | −23.3% |
| 1996 | 324 | +33.3% |
| 2001 | 366 | +13.0% |
| 2006 | 248 | −32.2% |
| 2011 | 226 | −8.9% |
| 2016 | 200 | −11.5% |
| 2021 | 188 | −6.0% |
| Source: Statistics Canada |
||
In the 2021 Canadian census, Mayo had 188 people. These people lived in 108 homes. This was a small decrease from 200 people in 2016. The village covers a land area of 0.98 square kilometers. This means there were about 191.8 people per square kilometer in 2021.
Geography of Mayo
Mayo's Climate
Mayo has a subarctic climate. This means it has warm summers and very cold winters. The winters last for about half the year. Spring and autumn are very short. Temperatures change quickly during these seasons.
Mayo has one of the biggest temperature differences ever recorded. The coldest temperature in February was -62.2 degrees Celsius. The hottest temperature in June was 36.1 degrees Celsius. That's a huge difference of 98.3 degrees Celsius! Mayo also has some of the warmest summers in the Yukon. The average summer temperature is 14.7 degrees Celsius.
| Climate data for Mayo (Mayo Airport) WMO ID: 71965; coordinates 63°37′N 135°52′W / 63.617°N 135.867°W; elevation: 503.8 m (1,653 ft); 1991–2020 normals, extremes 1924–present |
|||||||||||||
|---|---|---|---|---|---|---|---|---|---|---|---|---|---|
| Month | Jan | Feb | Mar | Apr | May | Jun | Jul | Aug | Sep | Oct | Nov | Dec | Year |
| Record high humidex | 9.6 | 12.2 | 15.6 | 22.5 | 33.2 | 38.5 | 37.3 | 34.6 | 29.2 | 22.5 | 13.3 | 11.4 | 38.5 |
| Record high °C (°F) | 10.1 (50.2) |
12.2 (54.0) |
15.8 (60.4) |
22.8 (73.0) |
33.5 (92.3) |
36.1 (97.0) |
35.6 (96.1) |
32.6 (90.7) |
26.7 (80.1) |
22.6 (72.7) |
13.9 (57.0) |
11.8 (53.2) |
36.1 (97.0) |
| Mean daily maximum °C (°F) | −18.1 (−0.6) |
−10.9 (12.4) |
−3.0 (26.6) |
7.5 (45.5) |
15.9 (60.6) |
21.6 (70.9) |
22.6 (72.7) |
19.5 (67.1) |
12.3 (54.1) |
1.7 (35.1) |
−10.6 (12.9) |
−14.6 (5.7) |
3.6 (38.5) |
| Daily mean °C (°F) | −23.2 (−9.8) |
−17.0 (1.4) |
−9.8 (14.4) |
1.2 (34.2) |
9.2 (48.6) |
14.7 (58.5) |
16.1 (61.0) |
13.3 (55.9) |
6.7 (44.1) |
−2.2 (28.0) |
−15.0 (5.0) |
−19.9 (−3.8) |
−2.2 (28.0) |
| Mean daily minimum °C (°F) | −28.3 (−18.9) |
−23.1 (−9.6) |
−16.6 (2.1) |
−5.1 (22.8) |
2.4 (36.3) |
7.8 (46.0) |
9.5 (49.1) |
7.0 (44.6) |
1.1 (34.0) |
−6.2 (20.8) |
−19.4 (−2.9) |
−25.1 (−13.2) |
−8.0 (17.6) |
| Record low °C (°F) | −58.3 (−72.9) |
−62.2 (−80.0) |
−48.9 (−56.0) |
−41.1 (−42.0) |
−21.7 (−7.1) |
−3.9 (25.0) |
−2.8 (27.0) |
−10.6 (12.9) |
−15.6 (3.9) |
−36.7 (−34.1) |
−50.6 (−59.1) |
−57.8 (−72.0) |
−62.2 (−80.0) |
| Record low wind chill | −65.8 | −60.0 | −59.0 | −36.5 | −19.0 | −3.8 | 0.0 | −9.1 | −22.8 | −38.2 | −55.1 | −64.3 | −65.8 |
| Average precipitation mm (inches) | 18.6 (0.73) |
12.9 (0.51) |
11.4 (0.45) |
9.8 (0.39) |
21.3 (0.84) |
42.5 (1.67) |
53.2 (2.09) |
45.6 (1.80) |
40.2 (1.58) |
25.9 (1.02) |
24.4 (0.96) |
21.2 (0.83) |
326.9 (12.87) |
| Average rainfall mm (inches) | 0.3 (0.01) |
0.1 (0.00) |
0.2 (0.01) |
3.7 (0.15) |
20.2 (0.80) |
42.4 (1.67) |
53.2 (2.09) |
45.4 (1.79) |
35.9 (1.41) |
9.1 (0.36) |
0.3 (0.01) |
0.1 (0.00) |
210.9 (8.30) |
| Average snowfall cm (inches) | 30.0 (11.8) |
20.0 (7.9) |
15.8 (6.2) |
7.4 (2.9) |
1.1 (0.4) |
0.1 (0.0) |
0.0 (0.0) |
0.0 (0.0) |
4.3 (1.7) |
20.3 (8.0) |
35.3 (13.9) |
33.0 (13.0) |
167.3 (65.9) |
| Average precipitation days (≥ 0.2 mm) | 10.5 | 8.4 | 6.4 | 5.5 | 9.0 | 13.3 | 15.1 | 14.2 | 13.2 | 11.7 | 12.7 | 11.6 | 131.5 |
| Average rainy days (≥ 0.2 mm) | 0.13 | 0.08 | 0.24 | 2.5 | 8.8 | 13.3 | 15.1 | 14.1 | 12.0 | 4.5 | 0.25 | 0.17 | 71.2 |
| Average snowy days (≥ 0.2 cm) | 12.2 | 9.0 | 6.8 | 3.4 | 0.63 | 0.04 | 0.0 | 0.0 | 1.4 | 8.5 | 13.4 | 12.9 | 68.3 |
| Average relative humidity (%) (at 1500 LST) | 79.3 | 74.4 | 59.2 | 43.7 | 37.0 | 40.2 | 47.2 | 50.9 | 55.1 | 70.8 | 80.1 | 80.7 | 59.9 |
| Source: Environment and Climate Change Canada | |||||||||||||
 | Frances Mary Albrier |
 | Whitney Young |
 | Muhammad Ali |


