
Mesick, Michigan facts for kids
Quick facts for kids
Mesick, Michigan
|
|
|---|---|
|
Village
|
|
| Village of Mesick | |
.jpg)
Looking east along Mesick Avenue (M-37 / M-115)
|
|
| Nickname(s):
"The Mushroom Capital"
|
|

Location within Wexford County
|
|

Mesick, Michigan
Location in Michigan

Mesick, Michigan
Location in the United States
|
|
| Country | |
| State | |
| County | Wexford |
| Townships | Antioch and Springville |
| Founded | 1890 |
| Incorporated | 1901 |
| Government | |
| • Type | Village council |
| Area | |
| • Total | 1.34 sq mi (3.46 km2) |
| • Land | 1.33 sq mi (3.44 km2) |
| • Water | 0.01 sq mi (0.02 km2) |
| Elevation | 942 ft (287 m) |
| Population
(2020)
|
|
| • Total | 397 |
| • Density | 298.72/sq mi (115.38/km2) |
| Time zone | UTC-5 (Eastern (EST)) |
| • Summer (DST) | UTC-4 (EDT) |
| ZIP code(s) |
49668
|
| Area code(s) | 231 |
| FIPS code | 26-53320 |
| GNIS feature ID | 1620798 |
Mesick (pronounced MEE-sik) is a small village in Wexford County, Michigan. In 2020, about 397 people lived there. Most of the village is in Springville Township, with a tiny part reaching into Antioch Township. Mesick is sometimes called "The Mushroom Capital."
Contents
History of Mesick
Mesick started as a settlement in 1890. It grew up along the Toledo, Ann Arbor and Northern Michigan Railroad. The village got its first post office on January 9, 1891. Henry Brooks was the first person to run the post office. Mesick officially became a village in 1901.
Geography and Location
Mesick is a small place, covering about 1.34 square miles (3.46 square kilometers). Most of this area is land, with a very small part being water.
The village is located in the Manistee River valley. Close to Mesick, you'll find Briar Hill. This is the highest point in the Lower Peninsula of Michigan.
Main Roads in Mesick
- M-37 is a major road that goes through the middle of the village, running east to west.
- M-115 also runs through Mesick, sharing the same path as M-37 for most of the village.
Mesick's Climate
Mesick experiences a range of weather throughout the year. Here's a look at the typical climate:
| Climate data for Mesick, MI | |||||||||||||
|---|---|---|---|---|---|---|---|---|---|---|---|---|---|
| Month | Jan | Feb | Mar | Apr | May | Jun | Jul | Aug | Sep | Oct | Nov | Dec | Year |
| Record high °F (°C) | 59 (15) |
60 (16) |
80 (27) |
83 (28) |
92 (33) |
98 (37) |
104 (40) |
99 (37) |
96 (36) |
84 (29) |
74 (23) |
59 (15) |
104 (40) |
| Mean daily maximum °F (°C) | 26 (−3) |
27 (−3) |
36 (2) |
52 (11) |
65 (18) |
75 (24) |
80 (27) |
78 (26) |
69 (21) |
57 (14) |
41 (5) |
30 (−1) |
53 (12) |
| Mean daily minimum °F (°C) | 11 (−12) |
9 (−13) |
18 (−8) |
30 (−1) |
41 (5) |
52 (11) |
56 (13) |
54 (12) |
48 (9) |
38 (3) |
27 (−3) |
17 (−8) |
33 (1) |
| Record low °F (°C) | −43 (−42) |
−36 (−38) |
−39 (−39) |
−12 (−24) |
14 (−10) |
18 (−8) |
31 (−1) |
27 (−3) |
19 (−7) |
10 (−12) |
−16 (−27) |
−22 (−30) |
−43 (−42) |
| Average precipitation inches (mm) | 1.7 (43) |
1.6 (41) |
1.9 (48) |
2.7 (69) |
3 (76) |
3.1 (79) |
2.9 (74) |
2.9 (74) |
3.5 (89) |
2.8 (71) |
2.7 (69) |
1.7 (43) |
30.4 (770) |
| Average snowfall inches (cm) | 18.4 (47) |
13 (33) |
13.5 (34) |
6.7 (17) |
0.3 (0.76) |
0 (0) |
0 (0) |
0 (0) |
0 (0) |
1.1 (2.8) |
12 (30) |
16.6 (42) |
81.6 (207) |
| Average precipitation days | 4.1 | 3.9 | 4.7 | 5.7 | 6.1 | 5.7 | 5.5 | 5.5 | 5.7 | 4.7 | 4.6 | 4 | 60.7 |
| Source: Weatherbase | |||||||||||||
Population of Mesick
The population of Mesick has changed over the years. Here's how many people have lived in the village during different census years:
| Historical population | |||
|---|---|---|---|
| Census | Pop. | %± | |
| 1910 | 510 | — | |
| 1920 | 318 | −37.6% | |
| 1930 | 303 | −4.7% | |
| 1940 | 327 | 7.9% | |
| 1950 | 359 | 9.8% | |
| 1960 | 304 | −15.3% | |
| 1970 | 376 | 23.7% | |
| 1980 | 374 | −0.5% | |
| 1990 | 406 | 8.6% | |
| 2000 | 447 | 10.1% | |
| 2010 | 394 | −11.9% | |
| 2020 | 397 | 0.8% | |
| U.S. Decennial Census | |||
In 2010, there were 394 people living in Mesick. About 25.9% of the residents were under 18 years old. The average age of people in the village was 37.8 years.
Images for kids
-
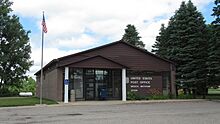
U.S. Post Office in Mesick -
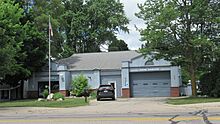
Mesick village office -
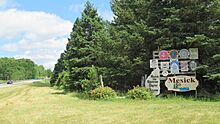
Road signage along M-115


See also
 In Spanish: Mesick (Míchigan) para niños
