Minonk, Illinois facts for kids
Quick facts for kids
Minonk
|
|
|---|---|

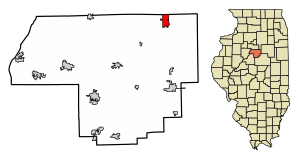
Location of Minonk in Woodford County, Illinois
|
|

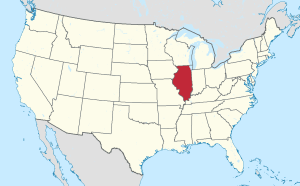
Location of Illinois in the United States
|
|
| Country | United States |
| State | Illinois |
| County | Woodford |
| Area | |
| • Total | 2.40 sq mi (6.22 km2) |
| • Land | 2.40 sq mi (6.22 km2) |
| • Water | 0.00 sq mi (0.00 km2) |
| Elevation | 747 ft (228 m) |
| Population
(2020)
|
|
| • Total | 1,928 |
| • Density | 803.33/sq mi (310.21/km2) |
| Time zone | UTC-6 (CST) |
| • Summer (DST) | UTC-5 (CDT) |
| ZIP Code(s) |
61760
|
| Area code(s) | 309 |
| FIPS code | 17-49568 |
| Wikimedia Commons | Minonk, Illinois |
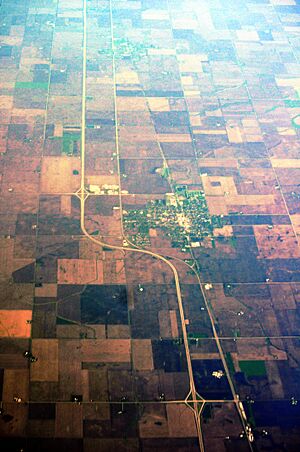
Minonk is a city located in Woodford County, Illinois. It is part of Minonk Township. In 2020, about 1,928 people lived there. Minonk is also part of the larger Peoria, Illinois, metropolitan area.
Geography

Minonk is located at 40°54′8″N 89°2′10″W / 40.90222°N 89.03611°W. This means it's in the northern part of the United States. The city covers an area of about 2.42 square miles (6.22 square kilometers). All of this area is land.
Climate
Minonk has a changing climate with warm summers and cold winters. The weather here can vary a lot throughout the year. For example, the highest temperature ever recorded was 111°F (44°C) in July. The lowest was -28°F (-33°C) in February.
The city gets about 37.65 inches (95.6 cm) of rain each year. Snowfall is around 21.7 inches (55.1 cm) per year. Most of the snow falls in winter months like January and December.
| Climate data for Minonk, Illinois (1991–2020 normals, extremes 1896–present) | |||||||||||||
|---|---|---|---|---|---|---|---|---|---|---|---|---|---|
| Month | Jan | Feb | Mar | Apr | May | Jun | Jul | Aug | Sep | Oct | Nov | Dec | Year |
| Record high °F (°C) | 69 (21) |
74 (23) |
88 (31) |
93 (34) |
103 (39) |
105 (41) |
111 (44) |
105 (41) |
104 (40) |
93 (34) |
82 (28) |
71 (22) |
111 (44) |
| Mean daily maximum °F (°C) | 32.8 (0.4) |
37.5 (3.1) |
49.6 (9.8) |
62.7 (17.1) |
74.2 (23.4) |
83.1 (28.4) |
86.1 (30.1) |
84.3 (29.1) |
79.0 (26.1) |
66.0 (18.9) |
50.6 (10.3) |
38.1 (3.4) |
62.0 (16.7) |
| Daily mean °F (°C) | 24.0 (−4.4) |
28.1 (−2.2) |
39.1 (3.9) |
50.7 (10.4) |
62.5 (16.9) |
71.8 (22.1) |
75.0 (23.9) |
73.0 (22.8) |
66.4 (19.1) |
54.0 (12.2) |
40.8 (4.9) |
29.6 (−1.3) |
51.2 (10.7) |
| Mean daily minimum °F (°C) | 15.2 (−9.3) |
18.8 (−7.3) |
28.6 (−1.9) |
38.8 (3.8) |
50.8 (10.4) |
60.6 (15.9) |
63.9 (17.7) |
61.7 (16.5) |
53.7 (12.1) |
42.0 (5.6) |
31.0 (−0.6) |
21.1 (−6.1) |
40.5 (4.7) |
| Record low °F (°C) | −25 (−32) |
−28 (−33) |
−14 (−26) |
6 (−14) |
24 (−4) |
36 (2) |
42 (6) |
38 (3) |
22 (−6) |
10 (−12) |
−9 (−23) |
−24 (−31) |
−28 (−33) |
| Average precipitation inches (mm) | 1.99 (51) |
1.84 (47) |
2.51 (64) |
3.66 (93) |
4.60 (117) |
3.98 (101) |
3.82 (97) |
3.48 (88) |
3.87 (98) |
3.08 (78) |
2.61 (66) |
2.21 (56) |
37.65 (956) |
| Average snowfall inches (cm) | 5.9 (15) |
5.2 (13) |
3.2 (8.1) |
0.8 (2.0) |
0.0 (0.0) |
0.0 (0.0) |
0.0 (0.0) |
0.0 (0.0) |
0.0 (0.0) |
0.0 (0.0) |
1.1 (2.8) |
5.5 (14) |
21.7 (55) |
| Average precipitation days (≥ 0.01 in) | 8.8 | 7.6 | 9.4 | 11.7 | 12.7 | 10.3 | 9.2 | 9.1 | 8.1 | 9.6 | 9.2 | 8.4 | 114.1 |
| Average snowy days (≥ 0.1 in) | 4.6 | 3.6 | 1.6 | 0.3 | 0.0 | 0.0 | 0.0 | 0.0 | 0.0 | 0.0 | 1.1 | 3.7 | 14.9 |
| Source: NOAA | |||||||||||||
Demographics
| Historical population | |||
|---|---|---|---|
| Census | Pop. | %± | |
| 1870 | 1,122 | — | |
| 1880 | 1,913 | 70.5% | |
| 1890 | 2,316 | 21.1% | |
| 1900 | 2,545 | 9.9% | |
| 1910 | 2,070 | −18.7% | |
| 1920 | 2,109 | 1.9% | |
| 1930 | 1,910 | −9.4% | |
| 1940 | 1,897 | −0.7% | |
| 1950 | 1,955 | 3.1% | |
| 1960 | 2,001 | 2.4% | |
| 1970 | 2,267 | 13.3% | |
| 1980 | 2,039 | −10.1% | |
| 1990 | 1,982 | −2.8% | |
| 2000 | 2,168 | 9.4% | |
| 2010 | 2,078 | −4.2% | |
| 2020 | 1,928 | −7.2% | |
| U.S. Decennial Census | |||
In 2000, Minonk had 2,168 people living there. There were 841 households, which are groups of people living together in one home. About 587 of these were families. The population density was about 1,587 people per square mile.
Many types of people live in Minonk. Most residents are White. A small number are of Asian or African American descent. Some residents are also of Hispanic or Latino background.
About 31.9% of households had children under 18. Most households (57.9%) were married couples. Around 26.8% of homes had just one person living there. About 15.6% of homes had someone aged 65 or older living alone.
The average age of people in Minonk was 39 years old. About 25.9% of the population was under 18. Around 20.8% were 65 years or older.
The median household income in 2000 was $44,028. This means half of the households earned more than this amount, and half earned less. The median income for families was $50,379. About 8.6% of all people in Minonk lived below the poverty line. This included 12.9% of children under 18.
History
Minonk was founded when the Illinois Central Railroad was being built. The main railroad line was finished in 1854. It passed right through the area that would become Minonk. The town's plan was officially recorded on November 7, 1854.
David Neal, who worked for the Illinois Central Railroad, is said to have named the city. There are different stories about where the name "Minonk" came from. One story says he named it after a street in Boston. Another story suggests he changed the name from "Marquette" (an old French map name) to "Minonk." This word means "a good place" in the Ojibwe language. Minonk is the only city in the world with this unique name!
Early settlers came to Minonk for different jobs. Many worked on the railroad. Others came to farm the rich land. But coal mining was the biggest industry in Minonk's early days. The first coal mines opened in the 1860s. At one point, over 300 men worked in the mines. There were two mines in Minonk. One was on the north edge of the city, and the other was a bit further north.
Sports
Minonk is home to Fieldcrest High School. Their football team is known as the Fieldcrest Knights.
See also
 In Spanish: Minonk (Illinois) para niños
 | Kyle Baker |
 | Joseph Yoakum |
 | Laura Wheeler Waring |
 | Henry Ossawa Tanner |


