Monson Center, Massachusetts facts for kids
Quick facts for kids
Monson Center, Massachusetts
|
|
|---|---|

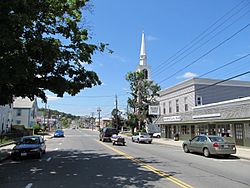
Main Street
|
|

Location in Hampden County in Massachusetts
|
|
| Country | United States |
| State | Massachusetts |
| County | Hampden |
| Town | Monson |
| Area | |
| • Total | 3.37 sq mi (8.72 km2) |
| • Land | 3.35 sq mi (8.69 km2) |
| • Water | 0.01 sq mi (0.03 km2) |
| Elevation | 370 ft (110 m) |
| Population
(2020)
|
|
| • Total | 1,952 |
| • Density | 581.82/sq mi (224.66/km2) |
| Time zone | UTC-5 (Eastern (EST)) |
| • Summer (DST) | UTC-4 (EDT) |
| ZIP Code |
01057 (Monson)
|
| Area code(s) | 413 |
| FIPS code | 25-42180 |
| GNIS feature ID | 2378172 |
Monson Center is a special kind of community in the town of Monson, Massachusetts. It's called a "census-designated place" (CDP). This means it's an area that the government counts separately for population, even though it's not a city or town by itself.
Monson Center is located in Hampden County, Massachusetts, in the United States. In 2020, about 1,952 people lived there. It is also part of the larger Springfield Metropolitan Statistical Area.
Contents
Exploring Monson Center's Location
Monson Center is found in the east-central part of the town of Monson. Its exact location is 42°5′51″N 72°18′54″W / 42.09750°N 72.31500°W. This area includes the main town center, a nearby village called South Monson, and some countryside around them.
Understanding the Boundaries
The community has clear borders. To the east, it reaches King Street and East Hill Road. To the south, its limits are Munn Street, Maple Street, and Bliss Street. On the west side, it extends to Ely Road, High Street, and Margaret Street. Finally, to the north, it goes up to Thompson Street, Chestnut Street, and Brimfield Road.
Rivers and Roads in Monson Center
The two villages within Monson Center are in a valley. This valley is home to Chicopee Creek, a stream that flows north into the Quaboag River. A main road, Massachusetts Route 32 (also known as Main Street), runs through this valley and the villages. This road connects Monson Center to Palmer about 4 miles north, and to Stafford Springs, Connecticut about 11 miles south.
Size of Monson Center
According to the United States Census Bureau, Monson Center covers a total area of about 8.7 square kilometers (3.37 square miles). Most of this area is land, with only a very small part, about 0.03 square kilometers (0.01 square miles), being water.
Who Lives in Monson Center?
| Historical population | |||
|---|---|---|---|
| Census | Pop. | %± | |
| 2020 | 1,952 | — | |
| U.S. Decennial Census | |||
In 2000, about 2,103 people lived in Monson Center. The population density was about 238.8 people per square kilometer (or 618.6 people per square mile).
Age Groups in the Community
The people living in Monson Center come from different age groups. About 26% of the population was under 18 years old. About 7.5% were young adults aged 18 to 24. The largest group, about 30.2%, was between 25 and 44 years old. About 21.8% were aged 45 to 64, and 14.5% were 65 years or older. The average age in Monson Center was 38 years old.
See also

- In Spanish: Monson Center para niños
 | Jewel Prestage |
 | Ella Baker |
 | Fannie Lou Hamer |

