Moroni, Utah facts for kids
Quick facts for kids
Moroni, Utah
|
|
|---|---|

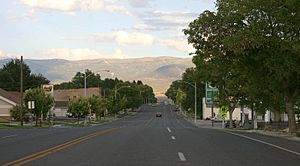
View looking east on Main Street (State Route 116/132)
|
|

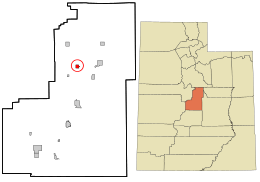
Location in Sanpete County and the state of Utah.
|
|
| Country | United States |
| State | Utah |
| County | Sanpete |
| Named for | Moroni |
| Area | |
| • Total | 1.06 sq mi (2.76 km2) |
| • Land | 1.06 sq mi (2.76 km2) |
| • Water | 0.00 sq mi (0.00 km2) |
| Elevation | 5,532 ft (1,686 m) |
| Population
(2010)
|
|
| • Total | 1,423 |
| • Estimate
(2019)
|
1,552 |
| • Density | 1,457.28/sq mi (562.88/km2) |
| Time zone | UTC-7 (Mountain (MST)) |
| • Summer (DST) | UTC-6 (MDT) |
| ZIP code |
84646
|
| Area code(s) | 435 |
| FIPS code | 49-52130 |
| GNIS feature ID | 1430498 |
Moroni (pronounced "mə-ROH-ny") is a city in Sanpete County, Utah, United States. In 2010, about 1,423 people lived there.
Contents
City Name
The city of Moroni is named after a prophet called Moroni. He is an important figure in the beliefs of the Church of Jesus Christ of Latter-day Saints.
City History
Moroni, Utah, was started in 1859 by a person named George Washington Bradley. He also became the leader of the local church community, known as a bishop, and served in that role for 18 years.
Geography and Climate
Moroni covers an area of about 1.1 square miles (2.8 square kilometers). All of this area is land.
Moroni's Climate
Moroni has a climate with big temperature changes throughout the year. Summers are warm to hot, and winters are cold, sometimes very cold. The temperature can also change a lot between day and night.
The city's climate is known as a humid continental climate. This means it has four distinct seasons. It also borders a cold semi-arid climate, which means it's quite dry.
| Climate data for Moroni, Utah, 1991–2020 normals, extremes 1910–present | |||||||||||||
|---|---|---|---|---|---|---|---|---|---|---|---|---|---|
| Month | Jan | Feb | Mar | Apr | May | Jun | Jul | Aug | Sep | Oct | Nov | Dec | Year |
| Record high °F (°C) | 66 (19) |
69 (21) |
80 (27) |
89 (32) |
94 (34) |
102 (39) |
107 (42) |
103 (39) |
99 (37) |
89 (32) |
79 (26) |
66 (19) |
107 (42) |
| Mean maximum °F (°C) | 50.7 (10.4) |
56.0 (13.3) |
69.3 (20.7) |
77.0 (25.0) |
84.2 (29.0) |
91.7 (33.2) |
96.3 (35.7) |
93.9 (34.4) |
89.3 (31.8) |
80.2 (26.8) |
66.9 (19.4) |
53.3 (11.8) |
96.8 (36.0) |
| Mean daily maximum °F (°C) | 38.1 (3.4) |
43.4 (6.3) |
54.6 (12.6) |
62.0 (16.7) |
71.1 (21.7) |
82.1 (27.8) |
89.0 (31.7) |
87.0 (30.6) |
79.1 (26.2) |
66.2 (19.0) |
51.7 (10.9) |
38.2 (3.4) |
63.5 (17.5) |
| Daily mean °F (°C) | 25.5 (−3.6) |
30.6 (−0.8) |
39.8 (4.3) |
45.8 (7.7) |
54.2 (12.3) |
63.2 (17.3) |
70.5 (21.4) |
68.9 (20.5) |
60.5 (15.8) |
49.0 (9.4) |
36.7 (2.6) |
25.7 (−3.5) |
47.5 (8.6) |
| Mean daily minimum °F (°C) | 12.9 (−10.6) |
17.7 (−7.9) |
25.1 (−3.8) |
29.6 (−1.3) |
37.2 (2.9) |
44.3 (6.8) |
52.0 (11.1) |
50.7 (10.4) |
41.9 (5.5) |
31.8 (−0.1) |
21.7 (−5.7) |
13.2 (−10.4) |
31.5 (−0.3) |
| Mean minimum °F (°C) | −5.2 (−20.7) |
1.4 (−17.0) |
11.3 (−11.5) |
18.9 (−7.3) |
25.5 (−3.6) |
3.36 (−15.91) |
42.0 (5.6) |
41.6 (5.3) |
29.4 (−1.4) |
18.1 (−7.7) |
7.0 (−13.9) |
−5.6 (−20.9) |
−9.5 (−23.1) |
| Record low °F (°C) | −30 (−34) |
−30 (−34) |
−8 (−22) |
9 (−13) |
15 (−9) |
24 (−4) |
30 (−1) |
28 (−2) |
15 (−9) |
−1 (−18) |
−13 (−25) |
−27 (−33) |
−30 (−34) |
| Average precipitation inches (mm) | 1.10 (28) |
1.14 (29) |
1.01 (26) |
1.19 (30) |
1.26 (32) |
0.71 (18) |
0.86 (22) |
0.91 (23) |
1.02 (26) |
1.24 (31) |
0.95 (24) |
1.16 (29) |
12.55 (319) |
| Source: NOAA | |||||||||||||
Population and People
| Historical population | |||
|---|---|---|---|
| Census | Pop. | %± | |
| 1860 | 703 | — | |
| 1870 | 633 | −10.0% | |
| 1880 | 838 | 32.4% | |
| 1890 | 958 | 14.3% | |
| 1900 | 1,224 | 27.8% | |
| 1910 | 1,223 | −0.1% | |
| 1920 | 1,355 | 10.8% | |
| 1930 | 1,218 | −10.1% | |
| 1940 | 1,158 | −4.9% | |
| 1950 | 1,076 | −7.1% | |
| 1960 | 879 | −18.3% | |
| 1970 | 894 | 1.7% | |
| 1980 | 1,086 | 21.5% | |
| 1990 | 1,115 | 2.7% | |
| 2000 | 1,280 | 14.8% | |
| 2010 | 1,423 | 11.2% | |
| 2019 (est.) | 1,552 | 9.1% | |
| U.S. Decennial Census | |||
In 2000, Moroni had 1,280 people living there. There were 399 households, and 316 of them were families. The city had about 1,194 people per square mile.
Most people in Moroni (about 82.58%) were White. About 20.55% of the population were of Hispanic or Latino background.
Many households (46.4%) had children under 18 living with them. Most households (68.2%) were married couples. The average household had about 3.21 people.
The population included many young people. About 35.5% were under 18 years old. The average age in the city was 28 years. For every 100 females, there were about 100.3 males.
The average income for a household in Moroni was $32,375. For families, it was $39,583. About 12.5% of all people in Moroni lived below the poverty line. This included 14.2% of those under 18.
Education
Moroni is part of the North Sanpete School District. The city has an elementary school and North Sanpete Middle School. Older students go to North Sanpete High School in Mount Pleasant.
See also
 In Spanish: Moroni (Utah) para niños
 | Misty Copeland |
 | Raven Wilkinson |
 | Debra Austin |
 | Aesha Ash |


