Morse, Wisconsin facts for kids
Quick facts for kids
Morse, Wisconsin
|
|
|---|---|

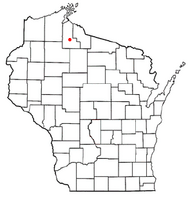
Location of Morse, Wisconsin
|
|
| Country | |
| State | |
| County | Ashland |
| Area | |
| • Total | 104.4 sq mi (270.3 km2) |
| • Land | 102.8 sq mi (266.2 km2) |
| • Water | 1.6 sq mi (4.1 km2) |
| Elevation | 1,391 ft (424 m) |
| Population
(2020)
|
|
| • Total | 499 |
| • Density | 4.781/sq mi (1.8461/km2) |
| Time zone | UTC-6 (Central (CST)) |
| • Summer (DST) | UTC-5 (CDT) |
| Area code(s) | 715 & 534 |
| FIPS code | 55-54400 |
| GNIS feature ID | 1583754 |
Morse is a small town located in Ashland County, which is in the state of Wisconsin in the United States. In 2020, about 499 people lived there.
Morse is home to several smaller communities. These include Ballou, Cayuga, Foster Junction, and Penokee.
Contents
Geography of Morse
Morse covers a total area of about 270.3 square kilometers (104.4 square miles). Most of this area is land. About 266.2 square kilometers (102.8 square miles) is land. The rest, about 4.1 square kilometers (1.6 square miles), is water. This means a small part of the town is made up of lakes or rivers.
Population and People
Let's look at the people who live in Morse. In 2000, there were 515 people living in the town. These people lived in 194 different homes. Out of these homes, 153 were families.
Population Density
The town's population density was about 5 people per square mile. This means there weren't many people living close together. There were also 380 housing units. This is about 3.7 homes per square mile.
Who Lives in Morse?
Most people in Morse were White, making up about 97% of the population. A small number were Native American or Asian. Some people were from other backgrounds. A very small number of people were Hispanic or Latino.
Households and Families
Many homes in Morse had children under 18 living there. About 34.5% of households had kids. Most households, about 71.6%, were married couples living together. Some homes had a female head of household without a husband. About 16% of all homes were single individuals. About 6.7% of homes had someone living alone who was 65 or older. The average home had 2.65 people. The average family had 2.99 people.
Age Groups
The population of Morse is spread across different age groups:
- About 24.5% were under 18 years old.
- About 5% were between 18 and 24 years old.
- About 31.7% were between 25 and 44 years old.
- About 25.8% were between 45 and 64 years old.
- About 13% were 65 years or older.
The average age in Morse was 39 years. For every 100 females, there were about 98.8 males.
Income in Morse
In 2000, the average income for a household in Morse was $39,000 per year. For families, the average income was $40,521. Men generally earned more than women. The average income per person in the town was $19,920.
A small number of families and people lived below the poverty line. This included about 2.5% of families and 2.6% of the total population. Only 1.7% of those under 18 were below the poverty line. No one aged 65 or over was below the poverty line.
See also
 In Spanish: Morse (Wisconsin) para niños
 | Audre Lorde |
 | John Berry Meachum |
 | Ferdinand Lee Barnett |

