
Mound City, Kansas facts for kids
Quick facts for kids
Mound City, Kansas
|
|
|---|---|
|
City and County seat
|
|

Linn County Kansas Courthouse (2020)
|
|

Location within Linn County and Kansas
|
|

|
|
| Country | United States |
| State | Kansas |
| County | Linn |
| Founded | 1855 |
| Incorporated | 1871 |
| Government | |
| • Type | Mayor–Council |
| Area | |
| • Total | 1.36 sq mi (3.51 km2) |
| • Land | 1.16 sq mi (2.99 km2) |
| • Water | 0.20 sq mi (0.52 km2) |
| Elevation | 879 ft (268 m) |
| Population
(2020)
|
|
| • Total | 647 |
| • Density | 475.7/sq mi (184.3/km2) |
| Time zone | UTC-6 (CST) |
| • Summer (DST) | UTC-5 (CDT) |
| ZIP code |
66056
|
| Area code | 913 |
| FIPS code | 20-48750 |
| GNIS ID | 477909 |
Mound City is a small city in Kansas, United States. It is the main town, or "county seat," of Linn County. In 2020, about 647 people lived there.
Contents
History of Mound City
Mound City was started in 1855. It got its name from a nearby hill called Sugar Mound. This hill was covered with many sugar maple trees.
During the American Civil War, a military base was set up in Mound City. In October 1864, the town was attacked twice by Confederate soldiers. They were leaving after losing a big battle called the Battle of Westport. The military base closed in June 1865 when the war ended.
Geography and Climate
Mound City covers a total area of about 1.27 square miles (3.29 square kilometers). Most of this area is land, with a small part being water.
Mound City's Climate
The weather in Mound City has hot and humid summers. Winters are usually mild to cool. This type of weather is known as a humid subtropical climate.
| Climate data for Mound City, Kansas, 1991–2020 normals, extremes 1949–present | |||||||||||||
|---|---|---|---|---|---|---|---|---|---|---|---|---|---|
| Month | Jan | Feb | Mar | Apr | May | Jun | Jul | Aug | Sep | Oct | Nov | Dec | Year |
| Record high °F (°C) | 77 (25) |
81 (27) |
88 (31) |
93 (34) |
98 (37) |
107 (42) |
117 (47) |
110 (43) |
105 (41) |
97 (36) |
84 (29) |
76 (24) |
117 (47) |
| Mean maximum °F (°C) | 63.0 (17.2) |
70.3 (21.3) |
78.2 (25.7) |
82.7 (28.2) |
87.3 (30.7) |
92.5 (33.6) |
97.8 (36.6) |
97.3 (36.3) |
92.3 (33.5) |
85.8 (29.9) |
73.7 (23.2) |
66.5 (19.2) |
99.4 (37.4) |
| Mean daily maximum °F (°C) | 40.8 (4.9) |
45.5 (7.5) |
56.3 (13.5) |
65.8 (18.8) |
74.4 (23.6) |
83.9 (28.8) |
88.5 (31.4) |
87.2 (30.7) |
79.4 (26.3) |
68.5 (20.3) |
54.9 (12.7) |
44.0 (6.7) |
65.8 (18.8) |
| Daily mean °F (°C) | 30.5 (−0.8) |
34.7 (1.5) |
44.9 (7.2) |
54.5 (12.5) |
64.0 (17.8) |
74.0 (23.3) |
78.6 (25.9) |
76.8 (24.9) |
67.9 (19.9) |
56.6 (13.7) |
44.2 (6.8) |
34.1 (1.2) |
55.1 (12.8) |
| Mean daily minimum °F (°C) | 20.2 (−6.6) |
23.9 (−4.5) |
33.6 (0.9) |
43.1 (6.2) |
53.6 (12.0) |
64.2 (17.9) |
68.7 (20.4) |
66.3 (19.1) |
56.4 (13.6) |
44.6 (7.0) |
33.5 (0.8) |
24.2 (−4.3) |
44.4 (6.9) |
| Mean minimum °F (°C) | 1.1 (−17.2) |
5.5 (−14.7) |
14.4 (−9.8) |
25.9 (−3.4) |
38.1 (3.4) |
49.7 (9.8) |
56.7 (13.7) |
54.5 (12.5) |
40.5 (4.7) |
26.5 (−3.1) |
15.4 (−9.2) |
4.6 (−15.2) |
−5.3 (−20.7) |
| Record low °F (°C) | −17 (−27) |
−20 (−29) |
−6 (−21) |
16 (−9) |
27 (−3) |
43 (6) |
44 (7) |
41 (5) |
28 (−2) |
17 (−8) |
3 (−16) |
−27 (−33) |
−27 (−33) |
| Average precipitation inches (mm) | 1.32 (34) |
1.95 (50) |
2.65 (67) |
4.44 (113) |
5.33 (135) |
5.29 (134) |
4.60 (117) |
3.55 (90) |
3.97 (101) |
3.57 (91) |
2.71 (69) |
1.88 (48) |
41.26 (1,049) |
| Average snowfall inches (cm) | 3.4 (8.6) |
2.4 (6.1) |
0.7 (1.8) |
trace | 0.0 (0.0) |
0.0 (0.0) |
0.0 (0.0) |
0.0 (0.0) |
0.0 (0.0) |
0.0 (0.0) |
0.5 (1.3) |
3.2 (8.1) |
10.2 (25.9) |
| Average precipitation days (≥ 0.01 in) | 6.4 | 4.7 | 7.7 | 9.8 | 11.5 | 9.0 | 8.6 | 6.8 | 8.4 | 8.5 | 6.7 | 5.1 | 93.2 |
| Average snowy days (≥ 0.1 in) | 2.0 | 1.7 | 0.4 | 0.0 | 0.0 | 0.0 | 0.0 | 0.0 | 0.0 | 0.0 | 0.3 | 1.8 | 6.2 |
| Source 1: NOAA (snow/snow days 1981–2010) | |||||||||||||
| Source 2: National Weather Service | |||||||||||||
People of Mound City (Demographics)
| Historical population | |||
|---|---|---|---|
| Census | Pop. | %± | |
| 1870 | 645 | — | |
| 1880 | 443 | −31.3% | |
| 1890 | 888 | 100.5% | |
| 1900 | 809 | −8.9% | |
| 1910 | 698 | −13.7% | |
| 1920 | 720 | 3.2% | |
| 1930 | 655 | −9.0% | |
| 1940 | 703 | 7.3% | |
| 1950 | 707 | 0.6% | |
| 1960 | 661 | −6.5% | |
| 1970 | 714 | 8.0% | |
| 1980 | 755 | 5.7% | |
| 1990 | 789 | 4.5% | |
| 2000 | 821 | 4.1% | |
| 2010 | 694 | −15.5% | |
| 2020 | 647 | −6.8% | |
| U.S. Decennial Census | |||
2020 Census Information
In 2020, the census counted 647 people living in Mound City. There were 285 households, which are groups of people living together.
Most of the people (about 93%) were white. Small numbers of people were black, Native American, or Asian. Some people were from two or more races. About 3.5% of the population was Hispanic or Latino.
About 23% of the people were under 18 years old. About 23% were 65 years or older. The average age in the city was 43.4 years.
2010 Census Information
In 2010, there were 694 people living in Mound City. There were 297 households.
Most people (about 96%) were white. Other groups included African American and Native American people. About 1.7% of the population was Hispanic or Latino.
About 23% of the people were under 18 years old. About 20% were 65 years or older. The average age in the city was 40.6 years.
Education
The public schools in Mound City are part of the Jayhawk USD 346 school district. Before schools were combined, the mascot for Mound City High School was the Eagles.
Images for kids
-
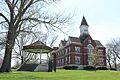
Linn County Kansas Courthouse (2020)
-
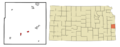
Location within Linn County and Kansas
-
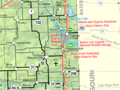
KDOT map of Linn County (legend)
See also
 In Spanish: Mound City (Kansas) para niños
