Mount Blanchard, Ohio facts for kids
Quick facts for kids
Mount Blanchard, Ohio
|
|
|---|---|
|
Village
|
|
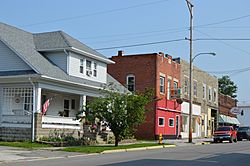
Main Street
|
|
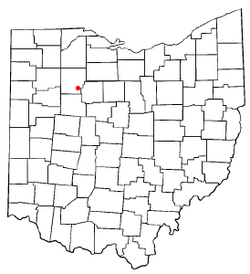
Location of Mount Blanchard, Ohio
|
|
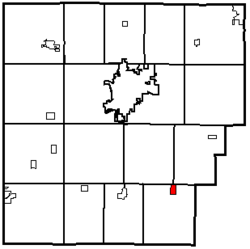
Location within Hancock County
|
|
| Country | United States |
| State | Ohio |
| County | Hancock |
| Government | |
| • Type | Village Council |
| Area | |
| • Total | 0.51 sq mi (1.32 km2) |
| • Land | 0.51 sq mi (1.32 km2) |
| • Water | 0.00 sq mi (0.00 km2) |
| Elevation | 843 ft (257 m) |
| Population
(2020)
|
|
| • Total | 471 |
| • Density | 923.53/sq mi (356.38/km2) |
| Time zone | UTC-5 (Eastern (EST)) |
| • Summer (DST) | UTC-4 (EDT) |
| ZIP code |
45867
|
| Area code(s) | 419 |
| FIPS code | 39-52598 |
| GNIS feature ID | 2399407 |
| Website | https://mtblanchardoh.com/villagesite/ |
Mount Blanchard is a small village located in Hancock County, Ohio, in the United States. In 2020, about 471 people lived there.
Contents
Village History
Mount Blanchard was officially planned out in 1830. It got its name because it sits high above the Blanchard River valley. A post office opened in the village in 1837. Later, in 1865, Mount Blanchard became an official village.
Where is Mount Blanchard?
The United States Census Bureau says the village covers a total area of about 0.54 square miles (1.32 square kilometers). All of this area is land, with no water.
Who Lives in Mount Blanchard?
| Historical population | |||
|---|---|---|---|
| Census | Pop. | %± | |
| 1880 | 285 | — | |
| 1890 | 421 | 47.7% | |
| 1900 | 456 | 8.3% | |
| 1910 | 497 | 9.0% | |
| 1920 | 427 | −14.1% | |
| 1930 | 401 | −6.1% | |
| 1940 | 442 | 10.2% | |
| 1950 | 444 | 0.5% | |
| 1960 | 432 | −2.7% | |
| 1970 | 473 | 9.5% | |
| 1980 | 492 | 4.0% | |
| 1990 | 491 | −0.2% | |
| 2000 | 484 | −1.4% | |
| 2010 | 492 | 1.7% | |
| 2020 | 471 | −4.3% | |
| U.S. Decennial Census | |||
Population in 2010
In 2010, there were 492 people living in Mount Blanchard. These people lived in 183 households, and 134 of these were families. The village had about 911 people per square mile.
Most of the people living in the village were White (96.5%). A small number were African American (0.4%), Pacific Islander (0.4%), or from other backgrounds. About 2.6% of the population was Hispanic or Latino.
About 40% of the households had children under 18 living with them. Most households (53%) were married couples. The average household had about 2.69 people. The average family had about 3.12 people.
The average age of people in the village was 34.3 years old. About 30.7% of residents were under 18. About 13.8% were 65 years or older. The population was almost evenly split between males (49.4%) and females (50.6%).
See also
 In Spanish: Mount Blanchard (Ohio) para niños
 | Georgia Louise Harris Brown |
 | Julian Abele |
 | Norma Merrick Sklarek |
 | William Sidney Pittman |

