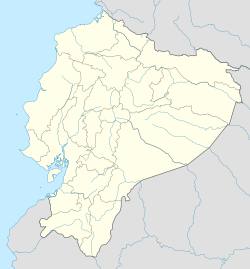
Naranjal, Ecuador facts for kids
Quick facts for kids
Naranjal
|
|
|---|---|
|
City
|
|
| Country | |
| Province | Guayas |
| Canton | Naranjal Canton |
| Area | |
| • City | 8.19 km2 (3.16 sq mi) |
| Population
(2022 census)
|
|
| • City | 39,323 |
| • Density | 4,801.3/km2 (12,435/sq mi) |
Naranjal is a city in Ecuador, a country in South America. It is located in the southern part of the Guayas Province, near the Azuay Province. Naranjal is the main town, or "seat," of Naranjal Canton. This canton was officially created in 1960.
According to a census taken in 2022, about 39,323 people live in Naranjal. The city is well-connected to other important cities in Ecuador. You can easily travel from Naranjal to Guayaquil, which is a very large city, and also to Machala. These connections help people and goods move around the region.
Climate in Naranjal
The climate of a place describes its usual weather patterns over a long time. Naranjal has a warm climate, which is typical for its location in Ecuador.
| Climate data for Naranjal, elevation 30 m (98 ft), (1961–1990) | |||||||||||||
|---|---|---|---|---|---|---|---|---|---|---|---|---|---|
| Month | Jan | Feb | Mar | Apr | May | Jun | Jul | Aug | Sep | Oct | Nov | Dec | Year |
| Mean daily maximum °C (°F) | 31.7 (89.1) |
31.7 (89.1) |
32.4 (90.3) |
32.4 (90.3) |
31.1 (88.0) |
29.7 (85.5) |
28.3 (82.9) |
28.8 (83.8) |
29.1 (84.4) |
29.2 (84.6) |
29.7 (85.5) |
31.3 (88.3) |
30.5 (86.8) |
| Daily mean °C (°F) | 26.2 (79.2) |
26.2 (79.2) |
26.6 (79.9) |
26.7 (80.1) |
26.1 (79.0) |
25.0 (77.0) |
24.1 (75.4) |
24.0 (75.2) |
24.0 (75.2) |
24.0 (75.2) |
24.3 (75.7) |
25.6 (78.1) |
25.2 (77.4) |
| Mean daily minimum °C (°F) | 21.6 (70.9) |
21.7 (71.1) |
22.0 (71.6) |
22.1 (71.8) |
21.6 (70.9) |
21.0 (69.8) |
19.8 (67.6) |
19.7 (67.5) |
19.7 (67.5) |
19.8 (67.6) |
19.7 (67.5) |
21.0 (69.8) |
20.8 (69.5) |
| Average precipitation mm (inches) | 186.0 (7.32) |
215.0 (8.46) |
225.0 (8.86) |
154.0 (6.06) |
73.0 (2.87) |
35.0 (1.38) |
9.0 (0.35) |
9.0 (0.35) |
13.0 (0.51) |
16.0 (0.63) |
17.0 (0.67) |
33.0 (1.30) |
985 (38.76) |
| Source: FAO | |||||||||||||
The table above shows the average temperatures and rainfall in Naranjal. You can see that the warmest months are usually from January to April. During these months, there is also more rain. The drier months are typically from July to October, with less rainfall.
See also
 In Spanish: Naranjal (Ecuador) para niños
 | Kyle Baker |
 | Joseph Yoakum |
 | Laura Wheeler Waring |
 | Henry Ossawa Tanner |


