
Neudorf, Lucerne facts for kids
Quick facts for kids
Neudorf
|
||
|---|---|---|
 |
||
|
||

Neudorf
Location in Switzerland

Neudorf
Location in Canton of Lucerne
|
||
| Country | Switzerland | |
| Canton | Lucerne | |
| District | Sursee | |
| Area | ||
| • Total | 12.83 km2 (4.95 sq mi) | |
| Elevation | 672 m (2,205 ft) | |
| Population
(Dec 2010)
|
||
| • Total | 1,196 | |
| • Density | 93.22/km2 (241.44/sq mi) | |
| Postal code |
6025
|
|
| Surrounded by | Beromünster, Gunzwil, Römerswil, Hildisrieden, Sempach , Eich | |

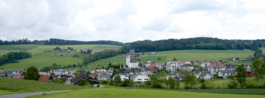
Neudorf was a small town, also known as a former municipality, in the canton of Lucerne, Switzerland. It was part of the Sursee district. On January 1, 2013, Neudorf officially joined with the nearby town of Beromünster. This means it is no longer a separate municipality.
Contents
A Look Back: Neudorf's History
Neudorf is a very old place! It was first mentioned in historical writings way back in the year 924. At that time, it was known by names like Niwidorf or Niudorf.
Neudorf's Location and Land
Before it merged, Neudorf covered an area of about 12.8 square kilometers (or 4.9 square miles). A large part of this land, about 60.6%, was used for farming. Forests covered another 33.5% of the area.
The remaining land was used for buildings and roads (5.4%). A very small part (0.5%) was non-productive, meaning it included rivers or other natural features. Neudorf was located in the upper part of a valley called the Wynental.
Who Lived in Neudorf?
As of 2010, Neudorf had a population of 1,196 people. About 7.7% of these residents were from other countries. Over the ten years before 2010, the population grew by about 5.9%.
Languages Spoken
Most people in Neudorf (around 94.9%) spoke German. Albanian was the second most common language, spoken by about 2.1% of the population. Spanish was the third most common, spoken by 0.6%.
Political Choices
In the 2007 election, the most popular political party was the FDP, which received 36.3% of the votes. The next most popular parties were the CVP (30.8%) and the SVP (21.4%). The Green Party received 4.8% of the votes.
Age Groups
The people living in Neudorf were spread across different age groups:
- About 27% of the population (309 people) were 0–19 years old.
- Around 27.6% (315 people) were 20–39 years old.
- The largest group, about 33.3% (381 people), were 40–64 years old.
- Older adults (65–79 years old) made up 9.8% (112 people).
- About 1.9% (22 people) were 80–89 years old.
- A very small group, 0.3% (4 people), were 90 years old or older.
Education and Homes
Most adults in Neudorf (about 72.3% of those aged 25-64) had completed higher education. This included either upper secondary education or a university degree.
In 2000, there were 348 households in Neudorf. About 21.6% of these households had only one person living in them. Around 19% were larger households with five or more members. Most homes were either two or three stories tall.
Jobs and Work
Neudorf had a low unemployment rate of 1.44%. In 2005, many people worked in farming, which is the primary economic sector. There were 112 people working in this area across 38 businesses.
The secondary sector, which includes manufacturing and construction, employed 143 people in 20 businesses. The tertiary sector, which includes services like shops and offices, employed 129 people in 26 businesses. In 2000, about 51.4% of the people in Neudorf had a job. Women made up 38.6% of the working population.
Religious Beliefs
In 2000, most people in Neudorf were Roman Catholic (80.4%). About 9.7% were Protestant. A small number of people belonged to other Christian faiths (0.47%) or were Muslim (2.46%). Some people did not belong to any organized religion (4.63%).
Population Over Time
Here's how Neudorf's population has changed throughout history:
| year | population |
|---|---|
| 1456 | c. 250 |
| about 1695 | up to 600 |
| 1798 | 710 |
| 1816 | 899 |
| 1850 | 850 |
| 1900 | 652 |
| 1950 | 791 |
| 2000 | 1,058 |
Gallery
-
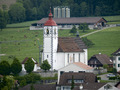
Church St. Agatha
-
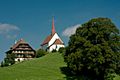
Pilgrimage church Gormund

See also
 In Spanish: Neudorf para niños
