North Johns, Alabama facts for kids
Quick facts for kids
North Johns, Alabama
|
|
|---|---|

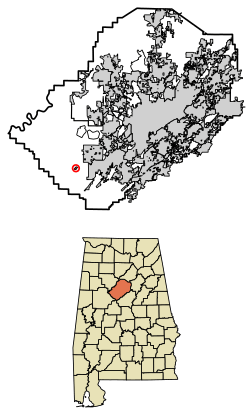
Location of North Johns in Jefferson County, Alabama.
|
|
| Country | United States |
| State | Alabama |
| County | Jefferson |
| Area | |
| • Total | 0.17 sq mi (0.43 km2) |
| • Land | 0.17 sq mi (0.43 km2) |
| • Water | 0.00 sq mi (0.00 km2) |
| Elevation | 502 ft (153 m) |
| Population
(2020)
|
|
| • Total | 127 |
| • Density | 769.70/sq mi (297.34/km2) |
| Time zone | UTC-6 (Central (CST)) |
| • Summer (DST) | UTC-5 (CDT) |
| ZIP code |
35006
|
| Area code(s) | 205 & 659 |
| FIPS code | 01-55152 |
| GNIS feature ID | 0124007 |
North Johns is a small town located in Jefferson County, Alabama, in the United States. It is the second smallest town in the county. You can find it about eight miles southwest of Hueytown, which is a suburb of Birmingham.
North Johns was once a very busy mining town. This was especially true in the early 1900s. Back then, more than 2,000 people lived in and around the area. The town is named after Llewellyn Johns, a mining engineer from Wales. He started coal mining operations here in the 1880s. In 2020, the town's population was 127 people. This was a small decrease from its population in 2010.
Contents
History of North Johns
North Johns officially became a town in July 1912. However, it first appeared in the U.S. Census records in 1930. In that census, it was simply called "Johns." From 1940 until today, it has been known as North Johns. The town's largest recorded population was in 1950. At that time, 454 people lived there.
Geography of North Johns
North Johns is located at these coordinates: 33°22′1″N 87°6′5″W / 33.36694°N 87.10139°W. This helps us pinpoint its exact spot on a map.
The U.S. Census Bureau states that the town covers a total area of about 0.2 square miles (0.5 square kilometers). All of this area is land, meaning there are no large bodies of water within the town limits.
Population and People
This section looks at how many people live in North Johns and what the population looks like.
Historical Population Changes
The table below shows how the number of people living in North Johns has changed over the years.
| Historical population | |||
|---|---|---|---|
| Census | Pop. | %± | |
| 1930 | 344 | — | |
| 1940 | 404 | 17.4% | |
| 1950 | 454 | 12.4% | |
| 1960 | 338 | −25.6% | |
| 1970 | 241 | −28.7% | |
| 1980 | 243 | 0.8% | |
| 1990 | 177 | −27.2% | |
| 2000 | 142 | −19.8% | |
| 2010 | 145 | 2.1% | |
| 2020 | 127 | −12.4% | |
| U.S. Decennial Census 2013 Estimate |
|||
2020 Census Information
The 2020 census counted 127 people living in North Johns. These people lived in 64 different households. Out of these households, 27 were considered families.
The table below shows the different racial groups that make up the population of North Johns, based on the 2020 census.
| Race | Num. | Perc. |
|---|---|---|
| White (non-Hispanic) | 68 | 53.54% |
| Black or African American (non-Hispanic) | 49 | 38.58% |
| Pacific Islander | 1 | 0.79% |
| Other/Mixed | 2 | 1.57% |
| Hispanic or Latino | 7 | 5.51% |
See also
 In Spanish: North Johns (Alabama) para niños
 | Shirley Ann Jackson |
 | Garett Morgan |
 | J. Ernest Wilkins Jr. |
 | Elijah McCoy |

