Orrum, North Carolina facts for kids
Quick facts for kids
Orrum, North Carolina
|
|
|---|---|
| Country | United States |
| State | North Carolina |
| County | Robeson |
| Founded | 1832 |
| Incorporated | 1903 |
| Named for | Variant of Orton |
| Area | |
| • Total | 0.48 sq mi (1.24 km2) |
| • Land | 0.48 sq mi (1.24 km2) |
| • Water | 0.00 sq mi (0.00 km2) |
| Elevation | 95 ft (29 m) |
| Population
(2020)
|
|
| • Total | 59 |
| • Density | 123.43/sq mi (47.64/km2) |
| Time zone | UTC-5 (Eastern (EST)) |
| • Summer (DST) | UTC-4 (EDT) |
| ZIP code |
28369
|
| Area codes | 910, 472 |
| FIPS code | 37-49460 |
| GNIS feature ID | 2407055 |
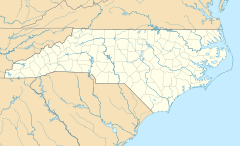
Orrum is a small town located in Robeson County, North Carolina, in the United States. In 2020, about 59 people lived there, according to the 2020 census.
History of Orrum
The area where Orrum is now located started as a community around the year 1832. It grew up around a place called Big Branch Church. The community officially became a town in 1903.
When people first thought about naming the town, they wanted to call it Orton. However, there was already a town named Orton nearby in Columbus County. So, the residents decided to pick a similar name, "Orrum," instead.
A special old building in the town, the Williams-Powell House, was added to the National Register of Historic Places in 1984. This means it's a very important historical place that should be protected.
Geography of Orrum
Orrum is a small town in terms of its size. The United States Census Bureau is a government group that collects information about the country. They reported that the town covers about 0.6 square miles (1.24 square kilometers) of land. There is no water area within the town limits.
People of Orrum (Demographics)
The numbers below show how the population of Orrum has changed over many years. This information comes from the U.S. Decennial Census, which counts people every ten years.
| Historical population | |||
|---|---|---|---|
| Census | Pop. | %± | |
| 1910 | 214 | — | |
| 1920 | 86 | −59.8% | |
| 1930 | 209 | 143.0% | |
| 1940 | 173 | −17.2% | |
| 1950 | 162 | −6.4% | |
| 1960 | 139 | −14.2% | |
| 1970 | 162 | 16.5% | |
| 1980 | 167 | 3.1% | |
| 1990 | 103 | −38.3% | |
| 2000 | 79 | −23.3% | |
| 2010 | 91 | 15.2% | |
| 2020 | 59 | −35.2% | |
| U.S. Decennial Census | |||
In the year 2000, a census counted 79 people living in Orrum. These people lived in 32 different homes, and 20 of these were families. The population density was about 140 people per square mile. This means that, on average, 140 people lived in each square mile of the town. There were also 36 housing units, which are places where people can live.
The people living in Orrum in 2000 included different groups. About 79.75% were White, 15.19% were African American, 2.53% were Native American, and 2.53% were Pacific Islander.
Out of the 32 homes:
- About 28.1% had children under 18 living there.
- 40.6% were married couples living together.
- 15.6% had a female head of the house with no husband present.
- 34.4% were not families.
Also, about 31.3% of all homes had only one person living in them. About 12.5% of homes had someone living alone who was 65 years old or older. On average, there were about 2.28 people in each home and 2.81 people in each family.
The ages of the people in Orrum in 2000 were spread out:
- 19.0% were under 18 years old.
- 7.6% were between 18 and 24 years old.
- 26.6% were between 25 and 44 years old.
- 34.2% were between 45 and 64 years old.
- 12.7% were 65 years old or older.
The average age of people in Orrum was 42 years. For every 100 females, there were about 83.7 males. For every 100 females aged 18 and over, there were about 88.2 males.
In 2000, the middle income for a home in Orrum was $25,417 per year. For families, the middle income was $35,000 per year. The average income per person in the town was $12,095. Some people and families lived below the poverty line, which means they had very low incomes. This included about 22.2% of families and 17.0% of all people.
See also
 In Spanish: Orrum para niños
 | Claudette Colvin |
 | Myrlie Evers-Williams |
 | Alberta Odell Jones |


