Osby facts for kids
Quick facts for kids
Osby
|
||
|---|---|---|

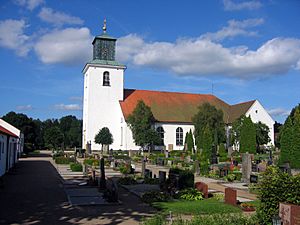
Osby Church
|
||
|
||
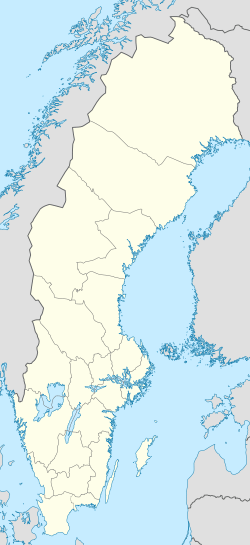
| Country | Sweden | |
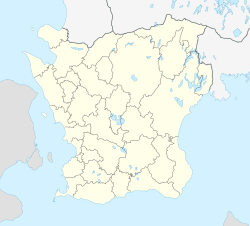
| Province | Scania | |
| County | Scania County | |
| Municipality | Osby Municipality | |
| Area | ||
| • Total | 8.27 km2 (3.19 sq mi) | |
| Population
(31 December 2010)
|
||
| • Total | 7,157 | |
| • Density | 866/km2 (2,240/sq mi) | |
| Time zone | UTC+1 (CET) | |
| • Summer (DST) | UTC+2 (CEST) | |
Osby (Swedish pronunciation: [ˈûːsbʏ]) is a town in Sweden. It is the main town of Osby Municipality in Scania County. In 2010, about 7,157 people lived here.
About Osby
Osby is a cool and interesting place in southern Sweden. It is known for a few special things.
Famous People from Osby
Did you know that a famous ice hockey goalie was born in Osby? His name is Magnus Åkerlund. He played as a professional ice hockey goaltender.
Fun Facts About BRIO
Osby was once the home of the famous toy company BRIO. BRIO makes awesome wooden toys and trains that many kids love! Even though the company moved to Malmö in 2006, their fun toy museum is still in Osby. It's called the BRIO Lekoseum. You can visit it and see lots of cool toys and learn about how they are made.
Osby's Weather
Osby has four distinct seasons, just like many places. Its weather is called an oceanic climate. This means it has mild winters and summers. Sometimes, the summers can get very warm. In May, the temperature has even reached 30 °C (86 °F)! Winters often drop below freezing for a few months.
| Climate data for Osby 2002–2018 (extremes since 1928; precipitation 1961-1990) | |||||||||||||
|---|---|---|---|---|---|---|---|---|---|---|---|---|---|
| Month | Jan | Feb | Mar | Apr | May | Jun | Jul | Aug | Sep | Oct | Nov | Dec | Year |
| Record high °C (°F) | 10.7 (51.3) |
16.3 (61.3) |
20.1 (68.2) |
28.0 (82.4) |
30.0 (86.0) |
34.5 (94.1) |
34.8 (94.6) |
34.0 (93.2) |
28.4 (83.1) |
23.2 (73.8) |
15.0 (59.0) |
12.5 (54.5) |
34.8 (94.6) |
| Mean maximum °C (°F) | 7.2 (45.0) |
7.9 (46.2) |
14.1 (57.4) |
20.4 (68.7) |
25.4 (77.7) |
27.0 (80.6) |
29.5 (85.1) |
27.9 (82.2) |
23.3 (73.9) |
17.1 (62.8) |
11.7 (53.1) |
8.5 (47.3) |
30.2 (86.4) |
| Mean daily maximum °C (°F) | 1.5 (34.7) |
2.1 (35.8) |
6.4 (43.5) |
12.7 (54.9) |
17.7 (63.9) |
20.3 (68.5) |
22.8 (73.0) |
21.5 (70.7) |
17.8 (64.0) |
11.4 (52.5) |
6.4 (43.5) |
3.1 (37.6) |
12.0 (53.6) |
| Daily mean °C (°F) | −0.7 (30.7) |
−0.4 (31.3) |
2.4 (36.3) |
7.3 (45.1) |
12.1 (53.8) |
15.1 (59.2) |
17.7 (63.9) |
16.9 (62.4) |
13.3 (55.9) |
8.1 (46.6) |
4.2 (39.6) |
1.1 (34.0) |
8.1 (46.6) |
| Mean daily minimum °C (°F) | −2.9 (26.8) |
−2.9 (26.8) |
−1.6 (29.1) |
1.8 (35.2) |
6.5 (43.7) |
9.9 (49.8) |
12.6 (54.7) |
12.2 (54.0) |
8.8 (47.8) |
4.7 (40.5) |
2.0 (35.6) |
−1.0 (30.2) |
4.2 (39.5) |
| Mean minimum °C (°F) | −13.6 (7.5) |
−11.0 (12.2) |
−9.6 (14.7) |
−3.8 (25.2) |
−0.2 (31.6) |
4.8 (40.6) |
7.9 (46.2) |
6.7 (44.1) |
1.7 (35.1) |
−3.3 (26.1) |
−6.0 (21.2) |
−9.7 (14.5) |
−16.1 (3.0) |
| Record low °C (°F) | −33.0 (−27.4) |
−29.0 (−20.2) |
−26.1 (−15.0) |
−14.0 (6.8) |
−7.0 (19.4) |
−3.0 (26.6) |
0.2 (32.4) |
−0.2 (31.6) |
−5.3 (22.5) |
−11.0 (12.2) |
−14.1 (6.6) |
−24.1 (−11.4) |
−33.0 (−27.4) |
| Average precipitation mm (inches) | 69.7 (2.74) |
51.4 (2.02) |
40.9 (1.61) |
38.6 (1.52) |
60.9 (2.40) |
76.5 (3.01) |
88.6 (3.49) |
79.6 (3.13) |
55.3 (2.18) |
80.5 (3.17) |
69.4 (2.73) |
70.5 (2.78) |
781.9 (30.78) |
| Source 1: SMHI | |||||||||||||
| Source 2: SMHI Monthly Data 2002–2018 | |||||||||||||
 | Valerie Thomas |
 | Frederick McKinley Jones |
 | George Edward Alcorn Jr. |
 | Thomas Mensah |


