Penndel, Pennsylvania facts for kids
Quick facts for kids
Penndel, Pennsylvania
|
||
|---|---|---|

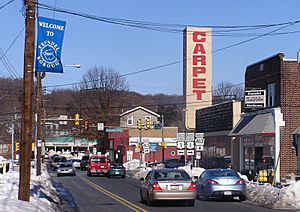
Downtown Penndel
|
||
|
||

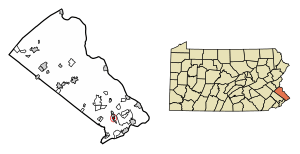
Location in Bucks County, Pennsylvania
|
||
| Country | United States | |
| State | Pennsylvania | |
| County | Bucks | |
| Founded | June 22, 1899 | |
| Area | ||
| • Total | 0.42 sq mi (1.08 km2) | |
| • Land | 0.42 sq mi (1.08 km2) | |
| • Water | 0.00 sq mi (0.00 km2) | |
| Elevation | 105 ft (32 m) | |
| Population
(2020)
|
||
| • Total | 2,515 | |
| • Density | 6,016.75/sq mi (2,324.52/km2) | |
| Time zone | UTC-5 (Eastern (EST)) | |
| • Summer (DST) | UTC-4 (EDT) | |
| ZIP code |
19047
|
|
| Area codes | 215, 267 and 445 | |
| FIPS code | 42-58936 | |
Penndel is a small town, called a borough, located in Bucks County, Pennsylvania, in the United States. In 2020, about 2,515 people lived there.
Contents
A Look Back: Penndel's History
Penndel has a long and interesting history. The land was first home to the Lenape people. Later, it was settled by English Quakers, Thomas Langhorne and Henry Paulin. They received land from William Penn, who founded Pennsylvania.
For many years, Penndel was mostly farmland. That changed in 1876 when the Philadelphia Reading Railroad started service. A train station was built in nearby Langhorne. In 1878, a company advertised 130 building lots in the area. They called it "The Eden of Bucks County."
Slowly, homes and small businesses grew near the railroad. The town began to expand. It started with a post office called Eden. On June 22, 1899, it officially became a borough named Attleboro. The name changed to South Langhorne in February 1911. Finally, on November 17, 1947, it became Penndel. Today, Penndel has both busy business areas and quiet neighborhoods.
Penndel's Location and Climate
Penndel is a small place, covering about 0.4 square miles (1.08 square kilometers) of land. It has no large bodies of water within its borders.
Weather in Penndel
Penndel has a climate with warm, humid summers and cool winters. This type of weather is called a Humid subtropical climate.
- Summers: Most summer days are a bit humid. Sometimes, it can get very hot and sticky. The hottest temperature ever recorded was 102.8°F (39.3°C) in July 2011. July is usually the wettest month, with lots of thunderstorms.
- Winters: Winters are cold. The coldest temperature ever recorded was -9.7°F (-23.2°C) in January 1984. Sometimes, strong winds make it feel even colder. Penndel usually gets between 24 and 30 inches (61-76 cm) of snow each winter. Big snowstorms and ice storms happen every few years, especially from December to February.
Who Lives in Penndel?
| Historical population | |||
|---|---|---|---|
| Census | Pop. | %± | |
| 1900 | 377 | — | |
| 1910 | 514 | 36.3% | |
| 1920 | 557 | 8.4% | |
| 1930 | 789 | 41.7% | |
| 1940 | 921 | 16.7% | |
| 1950 | 1,100 | 19.4% | |
| 1960 | 2,158 | 96.2% | |
| 1970 | 2,686 | 24.5% | |
| 1980 | 2,703 | 0.6% | |
| 1990 | 2,703 | 0.0% | |
| 2000 | 2,420 | −10.5% | |
| 2010 | 2,328 | −3.8% | |
| 2020 | 2,515 | 8.0% | |
| Sources: | |||
Penndel has grown quite a bit over the years. In 1900, only 377 people lived there. By 2020, the population had grown to 2,515 people.
The people living in Penndel come from many different backgrounds. In 2014, most residents were White. There were also significant numbers of Black or African American, Asian, and Hispanic or Latino people living in the borough.
In 2000, there were 900 households in Penndel. About 29% of these households had children under 18. The average household had about 2.4 people. The median age of people in Penndel was 32 years old. This means half the people were younger than 32, and half were older.
Arts and Culture
The Rumpf Factory
One important historical building in Penndel is the Rumpf Factory. It was finished in 1898 by Mr. Frederick Rumpf. His company, Rumpf & Sons, made cotton blankets, tablecloths, and napkins. The stone for the building came from a local farm. Sand was brought from a nearby town.
The original factory building was very large, with three stories. It was 405 feet long and 38 feet wide. It even had a direct connection to the railroad for easy transport of goods. Sadly, the first factory was destroyed by a fire in August 1901. But it was rebuilt in 1902. Today, the factory building is still standing, but it is mostly empty.
Learning in Penndel
Students in Penndel attend schools in the Neshaminy School District.
- Younger students (grades K-4) go to Herbert Hoover Elementary School.
- Middle schoolers (grades 5-8) attend Maple Point Middle School.
- High school students (grades 9-12) go to Neshaminy High School.
There is also another school option in Penndel. Our Lady of Grace is a Roman Catholic parish school located in the borough.
Getting Around Penndel
Penndel has about 7.83 miles (12.60 km) of public roads. Some roads are maintained by the state, and others by the borough itself.
Major Roads
- U.S. Route 1 Business is the most important highway in Penndel. It follows the Lincoln Highway, running from northeast to southwest through the town.
- Pennsylvania Route 413 briefly passes through the northern part of Penndel. It runs along Bellevue Avenue and Lincoln Highway.
- Pennsylvania Route 513 starts at PA 413 and goes south along Bellevue Avenue.
Public Transportation
SEPTA provides bus service in Penndel.
- Route 14 bus goes between the Frankford Transportation Center in Philadelphia and the Oxford Valley Mall.
- Route 129 bus also connects Northeast Philadelphia to the Oxford Valley Mall.
- Route 130 bus runs between Northeast Philadelphia and Bucks County Community College.
There is also a train station nearby called Langhorne station. It is part of the SEPTA Regional Rail system, serving the West Trenton Line.
See also
 In Spanish: Penndel para niños


