Port Mansfield, Texas facts for kids
Quick facts for kids
Port Mansfield, Texas
|
|
|---|---|
 |
|
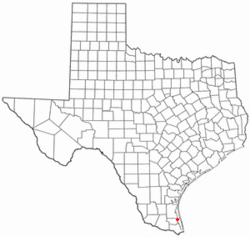
Location of Port Mansfield, Texas
|
|
 |
|
| Country | United States |
| State | Texas |
| County | Willacy |
| Area | |
| • Total | 5.7 sq mi (14.8 km2) |
| • Land | 5.2 sq mi (13.5 km2) |
| • Water | 0.5 sq mi (1.3 km2) |
| Elevation | 3 ft (1 m) |
| Population
(2020)
|
|
| • Total | 319 |
| • Density | 56.0/sq mi (21.55/km2) |
| Time zone | UTC-6 (Central (CST)) |
| • Summer (DST) | UTC-5 (CDT) |
| ZIP code |
78598
|
| Area code(s) | 956 |
| FIPS code | 48-58928 |
| GNIS feature ID | 1344369 |
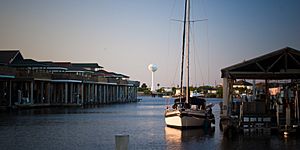
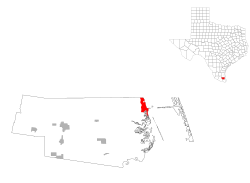
Port Mansfield is a small community in Willacy County, Texas, United States. It is known as a census-designated place (CDP). This means it's a special area defined by the government for counting people. In 2020, about 319 people lived there.
Port Mansfield is a quiet place. It is located on the coast of Texas. It is known for its fishing and outdoor activities.
Contents
Where is Port Mansfield?
Port Mansfield is located at 26°33′20″N 97°25′52″W / 26.55556°N 97.43111°W. It covers a total area of about 5.7 square miles (14.8 square kilometers). Most of this area is land, but about 0.5 square miles (1.3 square kilometers) is water.
A special channel connects Port Mansfield to the Intracoastal Waterway. This waterway is like a highway for boats along the coast. The channel also leads to the Gulf of Mexico. It cuts through Padre Island, which is a long, thin island. This cut is called the Port Mansfield Channel.
The channel needs to be kept deep for boats to pass easily. Sometimes, sand builds up and makes it shallow. This is called "shoaling." The channel was made deeper in 2009-2010. It was also dredged again in 2021. Now, it is 16–20 feet deep. This helps many boats use the channel safely.
Who Lives in Port Mansfield?
The number of people living in Port Mansfield changes over time. Every ten years, the United States government counts everyone. This is called a census.
| Historical population | |||
|---|---|---|---|
| Census | Pop. | %± | |
| 2020 | 319 | — | |
| U.S. Decennial Census 1850–1900 1910 1920 1930 1940 1950 1960 1970 1980 1990 2000 2010 |
|||
2020 Census Information
In 2020, the census counted 319 people living in Port Mansfield. There were 92 households and 31 families.
Here's a look at the different groups of people living there:
| Race | Number | Percentage |
|---|---|---|
| White (NH) | 233 | 73.04% |
| Black or African American (NH) | 1 | 0.31% |
| Some Other Race (NH) | 1 | 0.31% |
| Mixed/Multi-Racial (NH) | 7 | 2.19% |
| Hispanic or Latino | 77 | 24.14% |
| Total | 319 |
This table shows the different racial and ethnic groups. "NH" means "Non-Hispanic." For example, "White (NH)" means white people who are not Hispanic. "Hispanic or Latino" is a separate category.
What's the Weather Like?
Port Mansfield has a humid subtropical climate. This means it has hot, humid summers and mild winters. It's often sunny and warm.
The hottest temperature ever recorded in Port Mansfield was 104°F (40°C). This happened on May 11, 2006. The coldest temperature recorded was 15°F (-9°C). This happened on January 12, 1962, and again on December 23–24, 1989.
| Climate data for Port Mansfield, Texas, 1991–2020 normals, extremes 1958–present | |||||||||||||
|---|---|---|---|---|---|---|---|---|---|---|---|---|---|
| Month | Jan | Feb | Mar | Apr | May | Jun | Jul | Aug | Sep | Oct | Nov | Dec | Year |
| Record high °F (°C) | 92 (33) |
95 (35) |
101 (38) |
102 (39) |
104 (40) |
103 (39) |
102 (39) |
102 (39) |
102 (39) |
99 (37) |
98 (37) |
91 (33) |
104 (40) |
| Mean maximum °F (°C) | 81.6 (27.6) |
84.1 (28.9) |
87.0 (30.6) |
90.6 (32.6) |
91.3 (32.9) |
93.3 (34.1) |
94.7 (34.8) |
95.0 (35.0) |
94.3 (34.6) |
90.4 (32.4) |
87.4 (30.8) |
83.2 (28.4) |
98.7 (37.1) |
| Mean daily maximum °F (°C) | 67.7 (19.8) |
71.0 (21.7) |
75.6 (24.2) |
80.8 (27.1) |
85.3 (29.6) |
89.6 (32.0) |
90.6 (32.6) |
91.8 (33.2) |
88.5 (31.4) |
84.1 (28.9) |
76.4 (24.7) |
70.3 (21.3) |
81.0 (27.2) |
| Daily mean °F (°C) | 59.0 (15.0) |
62.8 (17.1) |
68.0 (20.0) |
73.6 (23.1) |
79.0 (26.1) |
83.1 (28.4) |
84.1 (28.9) |
84.7 (29.3) |
81.1 (27.3) |
76.0 (24.4) |
68.0 (20.0) |
61.2 (16.2) |
73.4 (23.0) |
| Mean daily minimum °F (°C) | 50.3 (10.2) |
54.5 (12.5) |
60.5 (15.8) |
66.5 (19.2) |
72.7 (22.6) |
76.6 (24.8) |
77.7 (25.4) |
77.5 (25.3) |
73.6 (23.1) |
68.0 (20.0) |
59.6 (15.3) |
52.2 (11.2) |
65.8 (18.8) |
| Mean minimum °F (°C) | 35.4 (1.9) |
37.9 (3.3) |
42.8 (6.0) |
52.6 (11.4) |
60.8 (16.0) |
71.0 (21.7) |
72.9 (22.7) |
72.9 (22.7) |
64.3 (17.9) |
50.8 (10.4) |
42.1 (5.6) |
35.5 (1.9) |
32.0 (0.0) |
| Record low °F (°C) | 15 (−9) |
20 (−7) |
29 (−2) |
38 (3) |
48 (9) |
58 (14) |
65 (18) |
64 (18) |
55 (13) |
32 (0) |
30 (−1) |
15 (−9) |
15 (−9) |
| Average precipitation inches (mm) | 1.13 (29) |
1.75 (44) |
1.33 (34) |
1.41 (36) |
2.39 (61) |
2.00 (51) |
2.39 (61) |
1.15 (29) |
5.37 (136) |
3.10 (79) |
1.98 (50) |
1.25 (32) |
25.25 (642) |
| Average snowfall inches (cm) | 0.0 (0.0) |
0.0 (0.0) |
0.0 (0.0) |
0.0 (0.0) |
0.0 (0.0) |
0.0 (0.0) |
0.0 (0.0) |
0.0 (0.0) |
0.0 (0.0) |
0.0 (0.0) |
0.0 (0.0) |
0.1 (0.25) |
0.1 (0.25) |
| Average precipitation days (≥ 0.01 in) | 6.3 | 5.1 | 4.4 | 3.6 | 4.2 | 4.1 | 3.6 | 2.8 | 8.7 | 5.5 | 4.8 | 5.7 | 58.8 |
| Average snowy days (≥ 0.1 in) | 0.0 | 0.0 | 0.0 | 0.0 | 0.0 | 0.0 | 0.0 | 0.0 | 0.0 | 0.0 | 0.0 | 0.0 | 0.0 |
| Source 1: NOAA | |||||||||||||
| Source 2: National Weather Service | |||||||||||||
Schools in Port Mansfield
Students in Port Mansfield go to schools in the San Perlita Independent School District. There are also special "magnet schools" run by the South Texas Independent School District. These schools offer unique programs for students.
See also

- In Spanish: Port Mansfield (Texas) para niños
 | May Edward Chinn |
 | Rebecca Cole |
 | Alexa Canady |
 | Dorothy Lavinia Brown |

