Quinn, South Dakota facts for kids
Quick facts for kids
Quinn, South Dakota
|
|
|---|---|
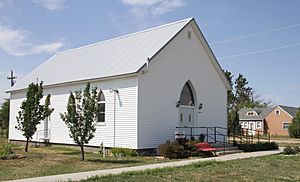
Quinn Community Center in 2017
|
|
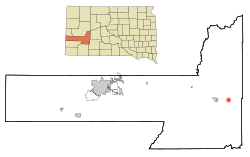
Location in Pennington County and the state of South Dakota
|
|
| Country | United States |
| State | South Dakota |
| County | Pennington |
| Founded | 1907 |
| Incorporated | 1920 |
| Area | |
| • Total | 1.20 sq mi (3.11 km2) |
| • Land | 1.20 sq mi (3.11 km2) |
| • Water | 0.00 sq mi (0.00 km2) |
| Elevation | 2,612 ft (796 m) |
| Population
(2020)
|
|
| • Total | 63 |
| • Density | 52.50/sq mi (20.27/km2) |
| Time zone | UTC-7 (Mountain (MST)) |
| • Summer (DST) | UTC-6 (MDT) |
| ZIP code |
57775
|
| Area code(s) | 605 |
| FIPS code | 46-52500 |
| GNIS feature ID | 1267541 |
Quinn is a small town in Pennington County, South Dakota, in the United States. In 2020, about 63 people lived there. It is known for the Badlands Observatory, a place where people study stars and space. This observatory is located in what used to be the community hospital.
Contents
History of Quinn
Quinn was started in 1907. The town was named after Michael Quinn, who was a local rancher. A post office opened in Quinn the same year. The Quinn Methodist Church is an important building in town. It is listed on the National Register of Historic Places.
Geography and Climate
Quinn's Location and Area
Quinn is located in South Dakota. According to the United States Census Bureau, the town covers an area of about 3.11 square kilometers (1.20 square miles). All of this area is land.
Weather in Quinn
The weather in Quinn, South Dakota, can change a lot. Summers are usually warm, and winters can be very cold. The town also gets some rain throughout the year.
| Month | Jan | Feb | Mar | Apr | May | Jun | Jul | Aug | Sep | Oct | Nov | Dec | Year |
|---|---|---|---|---|---|---|---|---|---|---|---|---|---|
| Record high °F (°C) | 73 (23) |
75 (24) |
88 (31) |
95 (35) |
105 (41) |
114 (46) |
117 (47) |
113 (45) |
108 (42) |
98 (37) |
85 (29) |
77 (25) |
117 (47) |
| Mean daily maximum °F (°C) | 35 (2) |
39 (4) |
48 (9) |
60 (16) |
70 (21) |
80 (27) |
90 (32) |
89 (32) |
78 (26) |
64 (18) |
48 (9) |
36 (2) |
90 (32) |
| Daily mean °F (°C) | 22 (−6) |
26 (−3) |
35 (2) |
45 (7) |
56 (13) |
66 (19) |
75 (24) |
73 (23) |
61 (16) |
48 (9) |
34 (1) |
23 (−5) |
47 (8) |
| Mean daily minimum °F (°C) | 9 (−13) |
12 (−11) |
21 (−6) |
30 (−1) |
42 (6) |
52 (11) |
59 (15) |
56 (13) |
44 (7) |
31 (−1) |
19 (−7) |
9 (−13) |
32 (0) |
| Record low °F (°C) | −42 (−41) |
−41 (−41) |
−33 (−36) |
−12 (−24) |
13 (−11) |
30 (−1) |
34 (1) |
27 (−3) |
10 (−12) |
−7 (−22) |
−29 (−34) |
−41 (−41) |
−42 (−41) |
| Average precipitation inches (mm) | 0.37 (9.4) |
0.60 (15) |
1.18 (30) |
1.70 (43) |
2.83 (72) |
2.98 (76) |
2.22 (56) |
1.46 (37) |
1.32 (34) |
1.36 (35) |
0.64 (16) |
0.38 (9.7) |
17.04 (433.1) |
| Source: The Weather Channel | |||||||||||||
Population and People
Population Changes Over Time
The number of people living in Quinn has changed over the years. Here is a look at the population from 1930 to 2020:
| Historical population | |||
|---|---|---|---|
| Census | Pop. | %± | |
| 1930 | 141 | — | |
| 1940 | 189 | 34.0% | |
| 1950 | 214 | 13.2% | |
| 1960 | 162 | −24.3% | |
| 1970 | 105 | −35.2% | |
| 1980 | 80 | −23.8% | |
| 1990 | 72 | −10.0% | |
| 2000 | 44 | −38.9% | |
| 2010 | 54 | 22.7% | |
| 2020 | 63 | 16.7% | |
| U.S. Decennial Census | |||
Quinn's Population in 2010
In 2010, there were 54 people living in Quinn. These people made up 23 households and 14 families. The town had about 27 homes.
Most of the people living in Quinn were White. Some residents were Native American or Asian. A small number of people were of Hispanic or Latino background.
Many households included married couples. Some households had children under 18 living with them. About one-fifth of households had someone living alone who was 65 years old or older. The average household had about 2.35 people.
The average age of people in Quinn in 2010 was about 41.5 years old. About 25.9% of residents were under 18. About 13% of the population was 65 years or older. More males lived in Quinn than females.
See also
 In Spanish: Quinn (Dakota del Sur) para niños
 | DeHart Hubbard |
 | Wilma Rudolph |
 | Jesse Owens |
 | Jackie Joyner-Kersee |
 | Major Taylor |

