Raymondville, Texas facts for kids
Quick facts for kids
Raymondville, Texas
|
|
|---|---|
| City of Raymondville | |

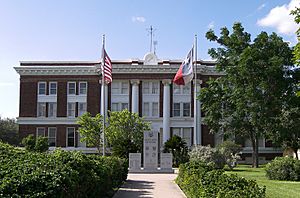
Willacy Court House
|
|

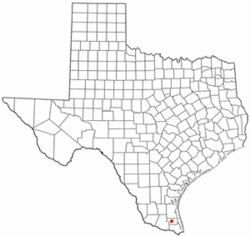
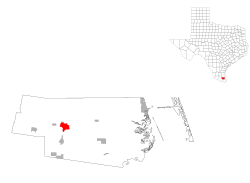
Location of Raymondville, Texas
|
|
 |
|
| Country | United States |
| State | Texas |
| County | Willacy |
| Area | |
| • Total | 4.13 sq mi (10.68 km2) |
| • Land | 4.12 sq mi (10.66 km2) |
| • Water | 0.01 sq mi (0.03 km2) |
| Elevation | 30 ft (9 m) |
| Population
(2020)
|
|
| • Total | 10,236 |
| • Density | 2,478.5/sq mi (958.4/km2) |
| Time zone | UTC-6 (Central (CST)) |
| • Summer (DST) | UTC-5 (CDT) |
| ZIP codes |
78580, 78598
|
| Area code(s) | 956 |
| FIPS code | 48-60836 |
| GNIS feature ID | 1377181 |
Raymondville is a city in Texas, USA. It's the main town, or county seat, of Willacy County. In 2020, about 10,236 people lived there. Raymondville is part of a larger area that includes cities like Brownsville and Harlingen.
The city was started in 1904 by Edward Burleson Raymond. He was a manager at a big ranch called El Sauz Ranch, which was part of the famous King Ranch.
Contents
Geography and Location
Raymondville is located at 26°28′53″N 97°46′59″W / 26.48139°N 97.78306°W. It is known as the "Gateway to the Rio Grande Valley." The city covers about 3.8 square miles (9.8 km2) of land.
Most of the soil in Raymondville is clay or sandy clay. These soils usually drain water well. Some parts of town have slightly salty soil, which can make farming a bit harder.
Climate and Weather
Raymondville has a humid subtropical climate. This means it has hot, humid summers. Winters are generally mild to cool.
| Climate data for Raymondville, Texas (1991–2020 normals, extremes 1913–present) | |||||||||||||
|---|---|---|---|---|---|---|---|---|---|---|---|---|---|
| Month | Jan | Feb | Mar | Apr | May | Jun | Jul | Aug | Sep | Oct | Nov | Dec | Year |
| Record high °F (°C) | 92 (33) |
99 (37) |
105 (41) |
106 (41) |
107 (42) |
109 (43) |
107 (42) |
107 (42) |
107 (42) |
102 (39) |
99 (37) |
94 (34) |
109 (43) |
| Mean daily maximum °F (°C) | 71.3 (21.8) |
76.0 (24.4) |
80.9 (27.2) |
86.7 (30.4) |
90.8 (32.7) |
95.3 (35.2) |
96.9 (36.1) |
98.3 (36.8) |
93.1 (33.9) |
88.2 (31.2) |
79.8 (26.6) |
72.8 (22.7) |
85.8 (29.9) |
| Daily mean °F (°C) | 59.7 (15.4) |
64.0 (17.8) |
69.3 (20.7) |
75.1 (23.9) |
80.3 (26.8) |
84.6 (29.2) |
85.9 (29.9) |
86.6 (30.3) |
82.4 (28.0) |
76.3 (24.6) |
67.9 (19.9) |
61.2 (16.2) |
74.4 (23.6) |
| Mean daily minimum °F (°C) | 48.1 (8.9) |
51.9 (11.1) |
57.8 (14.3) |
63.4 (17.4) |
69.8 (21.0) |
74.0 (23.3) |
74.9 (23.8) |
74.9 (23.8) |
71.6 (22.0) |
64.4 (18.0) |
56.1 (13.4) |
49.6 (9.8) |
63.0 (17.2) |
| Record low °F (°C) | 14 (−10) |
19 (−7) |
21 (−6) |
33 (1) |
45 (7) |
56 (13) |
61 (16) |
60 (16) |
45 (7) |
33 (1) |
28 (−2) |
15 (−9) |
14 (−10) |
| Average precipitation inches (mm) | 1.01 (26) |
1.02 (26) |
1.40 (36) |
1.35 (34) |
3.03 (77) |
2.58 (66) |
2.47 (63) |
2.09 (53) |
5.56 (141) |
2.97 (75) |
0.87 (22) |
1.12 (28) |
25.47 (647) |
| Average snowfall inches (cm) | 0.0 (0.0) |
0.0 (0.0) |
0.0 (0.0) |
0.0 (0.0) |
0.0 (0.0) |
0.0 (0.0) |
0.0 (0.0) |
0.0 (0.0) |
0.0 (0.0) |
0.0 (0.0) |
0.0 (0.0) |
0.2 (0.51) |
0.2 (0.51) |
| Average precipitation days (≥ 0.01 in) | 4.7 | 4.0 | 3.6 | 3.3 | 3.8 | 4.6 | 5.0 | 5.4 | 8.2 | 4.6 | 3.9 | 5.0 | 56.1 |
| Average snowy days (≥ 0.1 in) | 0.0 | 0.0 | 0.0 | 0.0 | 0.0 | 0.0 | 0.0 | 0.0 | 0.0 | 0.0 | 0.0 | 0.0 | 0.0 |
| Source: NOAA | |||||||||||||
Population and People
| Historical population | |||
|---|---|---|---|
| Census | Pop. | %± | |
| 1930 | 2,050 | — | |
| 1940 | 4,050 | 97.6% | |
| 1950 | 9,136 | 125.6% | |
| 1960 | 9,385 | 2.7% | |
| 1970 | 7,987 | −14.9% | |
| 1980 | 9,493 | 18.9% | |
| 1990 | 8,880 | −6.5% | |
| 2000 | 9,733 | 9.6% | |
| 2010 | 11,284 | 15.9% | |
| 2020 | 10,236 | −9.3% | |
| U.S. Decennial Census 1850–1900 1910 1920 1930 1940 1950 1960 1970 1980 1990 2000 2010 |
|||
2020 Census Details
| Race | Number | Percentage |
|---|---|---|
| White (NH) | 817 | 7.98% |
| Black or African American (NH) | 418 | 4.08% |
| Native American or Alaska Native (NH) | 15 | 0.15% |
| Asian (NH) | 148 | 1.45% |
| Some Other Race (NH) | 21 | 0.21% |
| Mixed/Multi-Racial (NH) | 19 | 0.19% |
| Hispanic or Latino | 8,798 | 85.95% |
| Total | 10,236 |
In 2020, there were 10,236 people living in Raymondville. These people lived in 2,826 households, with 2,151 of them being families.
City Facilities and Services
Raymondville has several important facilities and services for its residents.
- The United States Postal Service has a post office in Raymondville.
- The Raymondville Independent School District provides education for the city's students.
- The Reber Memorial Library is a local library where people can read and learn.
- The Raymondville Chronicle and Willacy County News is a weekly newspaper published in Raymondville.
Notable People
- Clinton Manges (1923–2010) was a businessman who lived in Raymondville. He built and owned a bowling alley in the city.
- Angela Via (born 1981) is a singer who was born and grew up in Raymondville.
Raymondville in Film
Raymondville's history was featured in a movie called Valley of Tears. This film looked at the Mexican-American community. They worked in the onion fields of South Texas during different time periods. The movie showed how changes from 20 years ago were making a difference today.
See also
 In Spanish: Raymondville (Texas) para niños
 | Kyle Baker |
 | Joseph Yoakum |
 | Laura Wheeler Waring |
 | Henry Ossawa Tanner |

