Regional District of Kitimat-Stikine facts for kids
Quick facts for kids
Kitimat-Stikine
|
||
|---|---|---|
|
Regional district
|
||
| Regional District of Kitimat-Stikine | ||

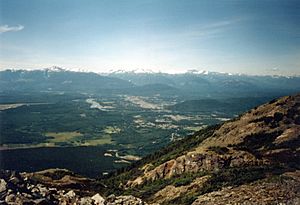
Terrace townsite
|
||
|
||

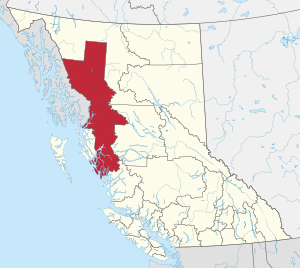
Location in British Columbia
|
||
| Country | Canada | |
| Province | British Columbia | |
| Administrative office location | Terrace | |
| Government | ||
| • Type | Regional district | |
| • Body | Board of Directors | |
| Area | ||
| • Land | 104,464.61 km2 (40,334.01 sq mi) | |
| Population
(2016)
|
||
| • Total | 37,367 | |
| • Density | 0.358/km2 (0.93/sq mi) | |
| Website | rdks.bc.ca | |
The Regional District of Kitimat-Stikine is a special type of local government in northwestern British Columbia, Canada. Think of it like a large area where different towns and communities work together. It helps manage services for people living there.
In 2016, about 37,367 people lived in this region. It covers a huge land area of over 104,000 square kilometers. That's bigger than many countries!
The main office for the regional district is in the city of Terrace. Another important town is Kitimat. Other towns include Hazelton, New Hazelton, and Stewart. Many smaller communities, including Indigenous communities, are also part of this large region. In 2007, the faraway community of Dease Lake joined the regional district.
Towns and Communities
This regional district includes several towns and communities. Each has its own type of local government. Here are the main ones:
- Terrace is a city and the largest community. It has about 15,723 people.
- Kitimat is a district municipality. About 8,335 people live there.
- New Hazelton is also a district municipality. It has a population of about 666.
- Stewart is a district municipality with around 494 residents.
- Hazelton is a village, home to about 270 people.
Population Changes Over Time
The number of people living in the Kitimat-Stikine region has changed over the years. Here's a quick look at how the population has grown or shrunk:
| Population history | ||
|---|---|---|
| Year | Pop. | ±% |
| 1996 | 43,618 | — |
| 2001 | 40,876 | −6.3% |
| 2006 | 37,999 | −7.0% |
| 2011 | 37,361 | −1.7% |
| 2016 | 37,367 | +0.0% |
| Source: Statistics Canada | ||
 | Lonnie Johnson |
 | Granville Woods |
 | Lewis Howard Latimer |
 | James West |

