San José del Cabo facts for kids
Quick facts for kids
San José del Cabo
|
|
|---|---|
|
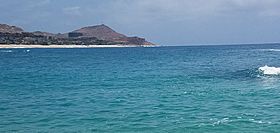
Top: San José del Cabo coastline; Middle: Los Cabos Town Hall, San José del Cabo main plaza; San José Estuary, Misión Estero de las Palmas de San José del Cabo Añuití
|
|
| Country | Mexico |
| State | Baja California Sur |
| Municipality | Los Cabos |
| Area | |
| • Total | 176.5 km2 (68.16 sq mi) |
| Elevation | 45 m (148 ft) |
| Population
(2020)
|
|
| • Total | 136,285 |
| • Density | 772.01/km2 (1,999.49/sq mi) |
| Time zone | UTC−7 (MST) |
| • Summer (DST) | UTC−6 (MDT) |
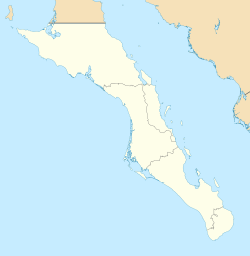
San José del Cabo (which means Saint Joseph of the Cape) is a city on the coast of the Gulf of California in Mexico. It is located near the southern tip of the state of Baja California Sur.
San José del Cabo sits by a shallow bay, about 32 kilometers (20 miles) northeast of Cabo San Lucas. These two cities together are known as Los Cabos.
San José del Cabo is the main city of the Los Cabos Municipality. In 2020, about 136,285 people lived there. The city and Cabo San Lucas are both served by the Los Cabos International Airport.
Contents
History and People of San José del Cabo
In 2020, the city was home to 136,285 people. San José del Cabo and its nearby city, Cabo San Lucas, are very popular places for tourists. In 2011, over 900,000 hotel guests visited the area.
The Mission and the River
A mission called Misión Estero de las Palmas de San José del Cabo Añuití was started in 1730. It was built near the Río San José river. This river flows into a large freshwater area called an estuary.
The river starts in the Sierra de la Laguna (Laguna Mountains) and flows mostly underground for about 39 kilometers (24 miles). For hundreds of years, this river has given fresh water to people and animals in this desert area. Spanish ships, called galleons, used to stop here for water when traveling from the Philippines.
Until the early 1900s, the river flowed above ground. But human activities caused it to go mostly underground. A sandbar, about one kilometer long, separates the estuary from the ocean. Early Spanish explorers called this ocean area the Bahía de San Bernabé, but now it's known as Bahía de San José del Cabo.
Local Wildlife
San José del Cabo is one of only two places where a very rare animal, the Oryzomys peninsulae (a type of rice rat), still lives. It is critically endangered, meaning it is at high risk of becoming extinct.
Geography and Climate
What is the Climate Like?
San José del Cabo has a tropical desert climate. This means it is very hot and dry, like most of the Baja California peninsula. However, this area gets a little more rain than places further north.
This extra rain often comes from tropical cyclones (like hurricanes) that sometimes move in from the south. These storms can bring a lot of rain very quickly. For example, about 340 mm (13 inches) of rain fell on September 1, 1998. Another time, 316 mm (12 inches) fell on November 3, 1993. Because of these cyclones, rainfall can be very sudden and heavy. Some years might pass with almost no rain at all.
Ocean Temperatures
The sea water around San José del Cabo is warm all year. In winter, the water temperature is usually around 22–23°C (72–73°F). In the summer months, it gets warmer, reaching about 25–29°C (77–84°F).
| Jan | Feb | Mar | Apr | May | Jun | Jul | Aug | Sep | Oct | Nov | Dec |
|---|---|---|---|---|---|---|---|---|---|---|---|
| 73 °F
23 °C |
72 °F
22 °C |
72 °F
22 °C |
72 °F
22 °C |
73 °F
23 °C |
77 °F
25 °C |
81 °F
27 °C |
84 °F
29 °C |
84 °F
29 °C |
84 °F
29 °C |
81 °F
27 °C |
77 °F
25 °C |
| Climate data for San José del Cabo | |||||||||||||
|---|---|---|---|---|---|---|---|---|---|---|---|---|---|
| Month | Jan | Feb | Mar | Apr | May | Jun | Jul | Aug | Sep | Oct | Nov | Dec | Year |
| Record high °C (°F) | 37.0 (98.6) |
38.0 (100.4) |
39.0 (102.2) |
39.0 (102.2) |
40.0 (104.0) |
38.0 (100.4) |
39.0 (102.2) |
42.0 (107.6) |
42.0 (107.6) |
41.0 (105.8) |
40.0 (104.0) |
39.0 (102.2) |
42.0 (107.6) |
| Mean daily maximum °C (°F) | 25.8 (78.4) |
26.4 (79.5) |
27.4 (81.3) |
29.1 (84.4) |
30.9 (87.6) |
32.6 (90.7) |
33.8 (92.8) |
33.9 (93.0) |
33.4 (92.1) |
32.3 (90.1) |
30.1 (86.2) |
26.9 (80.4) |
30.2 (86.4) |
| Daily mean °C (°F) | 18.9 (66.0) |
19.2 (66.6) |
20.1 (68.2) |
21.9 (71.4) |
24.0 (75.2) |
26.5 (79.7) |
28.5 (83.3) |
28.9 (84.0) |
28.2 (82.8) |
26.2 (79.2) |
23.2 (73.8) |
20.2 (68.4) |
23.8 (74.8) |
| Mean daily minimum °C (°F) | 12.0 (53.6) |
12.0 (53.6) |
12.8 (55.0) |
14.8 (58.6) |
17.1 (62.8) |
20.5 (68.9) |
23.3 (73.9) |
23.8 (74.8) |
23.0 (73.4) |
20.1 (68.2) |
16.3 (61.3) |
13.4 (56.1) |
17.4 (63.3) |
| Record low °C (°F) | 1.5 (34.7) |
2.0 (35.6) |
5.0 (41.0) |
6.0 (42.8) |
9.0 (48.2) |
11.0 (51.8) |
11.5 (52.7) |
11.0 (51.8) |
11.0 (51.8) |
11.0 (51.8) |
9.2 (48.6) |
3.0 (37.4) |
1.5 (34.7) |
| Average rainfall mm (inches) | 13.1 (0.52) |
5.3 (0.21) |
1.3 (0.05) |
1.0 (0.04) |
0.3 (0.01) |
0.9 (0.04) |
20.5 (0.81) |
53.6 (2.11) |
112.5 (4.43) |
42.9 (1.69) |
25.2 (0.99) |
11.4 (0.45) |
288.0 (11.34) |
| Average rainy days | 1.4 | 0.6 | 0.2 | 0.1 | 0.0 | 0.1 | 1.4 | 3.0 | 3.9 | 2.0 | 0.8 | 1.1 | 14.6 |
| Source: Servicio Meteorológico National | |||||||||||||
Population Growth in San José del Cabo
| Historical population | ||
|---|---|---|
| Year | Pop. | ±% |
| 1990 | 13,302 | — |
| 1995 | 21,737 | +63.4% |
| 2000 | 31,102 | +43.1% |
| 2010 | 69,788 | +124.4% |
| 2015 | 93,069 | +33.4% |
| 2020 | 136,285 | +46.4% |
San José del Cabo has grown a lot over the years. Many people from all over the world have chosen to live here. This includes people from the USA, Canada, New Zealand, Australia, China, Korea, Japan, Spain, and the United Kingdom.
Most of the people (about 80%) who live here originally come from other parts of Latin America. This includes Mexico, Central America, and South America. Because of this, you can hear and experience many different ways of speaking Spanish in the city.
See also
 In Spanish: San José del Cabo para niños
 | Isaac Myers |
 | D. Hamilton Jackson |
 | A. Philip Randolph |


