Sanborn, Iowa facts for kids
Quick facts for kids
Sanborn, Iowa
|
|
|---|---|

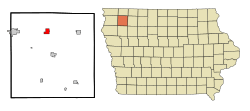
Location of Sanborn, Iowa
|
|
| Country | |
| State | |
| County | O'Brien |
| Government | |
| • Type | Mayor-council |
| Area | |
| • Total | 1.88 sq mi (4.86 km2) |
| • Land | 1.88 sq mi (4.86 km2) |
| • Water | 0.00 sq mi (0.00 km2) |
| Elevation | 1,552 ft (473 m) |
| Population
(2020)
|
|
| • Total | 1,392 |
| • Density | 741.21/sq mi (286.22/km2) |
| Time zone | UTC-6 (Central (CST)) |
| • Summer (DST) | UTC-5 (CDT) |
| ZIP code |
51248
|
| Area code(s) | 712 |
| FIPS code | 19-70410 |
| GNIS feature ID | 0461387 |
Sanborn is a small city located in O'Brien County, Iowa, in the United States. It's a friendly place with a population of about 1,392 people, according to the 2020 census. Sanborn is known for its quiet community life and its connection to the history of railroads in Iowa.
Contents
Sanborn's Early Days
Sanborn began its story in 1871. This was when the Chicago, Milwaukee & St. Paul Railway built its tracks through the area. The city was named after George W. Sanborn, who was the president of this railroad company.
Sanborn officially became a town in 1880. This meant it could set up its own local government and services.
Where is Sanborn Located?
Sanborn is found at these coordinates: 43°10′59″N 95°39′24″W / 43.18306°N 95.65667°W. This helps pinpoint its exact spot on a map.
The city covers a total area of about 1.90 square miles (4.86 square kilometers). All of this area is land, meaning there are no large lakes or rivers within the city limits.
What's the Weather Like in Sanborn?
Sanborn experiences a wide range of weather throughout the year. Summers can be warm, while winters are typically cold with snow. The city gets a good amount of rain, especially in the spring and summer months.
| Climate data for Sanborn, Iowa (1991−2020 normals, extremes 1914−present) | |||||||||||||
|---|---|---|---|---|---|---|---|---|---|---|---|---|---|
| Month | Jan | Feb | Mar | Apr | May | Jun | Jul | Aug | Sep | Oct | Nov | Dec | Year |
| Record high °F (°C) | 65 (18) |
65 (18) |
84 (29) |
92 (33) |
107 (42) |
102 (39) |
110 (43) |
108 (42) |
103 (39) |
92 (33) |
77 (25) |
65 (18) |
110 (43) |
| Mean maximum °F (°C) | 44.1 (6.7) |
49.3 (9.6) |
67.3 (19.6) |
79.8 (26.6) |
87.9 (31.1) |
91.4 (33.0) |
91.7 (33.2) |
90.5 (32.5) |
87.3 (30.7) |
81.7 (27.6) |
64.8 (18.2) |
48.0 (8.9) |
93.8 (34.3) |
| Mean daily maximum °F (°C) | 24.0 (−4.4) |
28.3 (−2.1) |
41.5 (5.3) |
56.5 (13.6) |
68.7 (20.4) |
78.9 (26.1) |
82.5 (28.1) |
80.0 (26.7) |
73.5 (23.1) |
59.7 (15.4) |
43.1 (6.2) |
28.9 (−1.7) |
55.5 (13.1) |
| Daily mean °F (°C) | 15.0 (−9.4) |
19.2 (−7.1) |
31.8 (−0.1) |
45.1 (7.3) |
57.8 (14.3) |
68.4 (20.2) |
72.2 (22.3) |
69.8 (21.0) |
61.8 (16.6) |
48.4 (9.1) |
33.2 (0.7) |
20.6 (−6.3) |
45.3 (7.4) |
| Mean daily minimum °F (°C) | 6.1 (−14.4) |
10.2 (−12.1) |
22.1 (−5.5) |
33.8 (1.0) |
46.9 (8.3) |
58.0 (14.4) |
62.0 (16.7) |
59.6 (15.3) |
50.2 (10.1) |
37.1 (2.8) |
23.4 (−4.8) |
12.3 (−10.9) |
35.1 (1.7) |
| Mean minimum °F (°C) | −16.4 (−26.9) |
−11.3 (−24.1) |
−0.3 (−17.9) |
18.3 (−7.6) |
32.6 (0.3) |
45.9 (7.7) |
51.2 (10.7) |
49.4 (9.7) |
35.1 (1.7) |
20.2 (−6.6) |
5.3 (−14.8) |
−10.4 (−23.6) |
−19.9 (−28.8) |
| Record low °F (°C) | −33 (−36) |
−35 (−37) |
−20 (−29) |
3 (−16) |
16 (−9) |
34 (1) |
38 (3) |
34 (1) |
22 (−6) |
2 (−17) |
−16 (−27) |
−29 (−34) |
−35 (−37) |
| Average precipitation inches (mm) | 0.91 (23) |
1.10 (28) |
1.90 (48) |
3.40 (86) |
4.49 (114) |
4.86 (123) |
3.37 (86) |
3.50 (89) |
3.31 (84) |
2.47 (63) |
1.59 (40) |
1.17 (30) |
32.07 (815) |
| Average snowfall inches (cm) | 8.2 (21) |
9.1 (23) |
6.3 (16) |
3.2 (8.1) |
0.1 (0.25) |
0.0 (0.0) |
0.0 (0.0) |
0.0 (0.0) |
0.0 (0.0) |
0.5 (1.3) |
4.5 (11) |
9.5 (24) |
41.4 (105) |
| Average precipitation days (≥ 0.01 in) | 7.5 | 6.3 | 7.7 | 10.3 | 13.7 | 12.3 | 8.8 | 9.2 | 8.8 | 8.2 | 5.9 | 6.9 | 105.6 |
| Average snowy days (≥ 0.1 in) | 5.5 | 4.8 | 3.1 | 1.5 | 0.1 | 0.0 | 0.0 | 0.0 | 0.0 | 0.6 | 2.7 | 4.9 | 23.2 |
| Source: NOAA | |||||||||||||
How Many People Live in Sanborn?
The number of people living in Sanborn has changed over the years. Here's a look at the population counts from different censuses:
| Historical population | |||
|---|---|---|---|
| Census | Pop. | %± | |
| 1880 | 364 | — | |
| 1890 | 1,075 | 195.3% | |
| 1900 | 1,247 | 16.0% | |
| 1910 | 1,174 | −5.9% | |
| 1920 | 1,497 | 27.5% | |
| 1930 | 1,213 | −19.0% | |
| 1940 | 1,344 | 10.8% | |
| 1950 | 1,337 | −0.5% | |
| 1960 | 1,323 | −1.0% | |
| 1970 | 1,465 | 10.7% | |
| 1980 | 1,398 | −4.6% | |
| 1990 | 1,345 | −3.8% | |
| 2000 | 1,353 | 0.6% | |
| 2010 | 1,404 | 3.8% | |
| 2020 | 1,392 | −0.9% | |
| U.S. Decennial Census | |||
Sanborn's Population in 2020
In 2020, Sanborn had 1,392 residents. There were 579 households, which are groups of people living together. The city's population density was about 741 people per square mile.
Most people in Sanborn identified as White (92.0%). There were also smaller groups of Black or African American, Native American, and Asian residents. About 5.0% of the population was Hispanic or Latino.
The median age in Sanborn was 42.7 years. This means half the people were younger than 42.7 and half were older. About 25.6% of the residents were under 20 years old.
Sanborn's Population in 2010
In 2010, Sanborn had 1,404 people living in the city. There were 574 households. The population density was about 739 people per square mile.
The majority of residents (97.6%) were White. About 2.3% of the population identified as Hispanic or Latino.
The median age in 2010 was 44.2 years. About 24.4% of the residents were under 18 years old.
Schools in Sanborn
Sanborn is part of the Hartley–Melvin–Sanborn Community School District. This school district was created in 1991 when the Hartley–Melvin and Sanborn school districts joined together.
The city is home to the Hartley–Melvin–Sanborn Middle School. This is where students in the middle grades attend classes.
Sanborn also has a private school called Sanborn Christian School. It serves students from preschool up to eighth grade.
Famous People from Sanborn
Many interesting people have come from Sanborn, Iowa. Here are a few:
- William D. Boies: A politician, which is someone who works in government and helps make laws.
- Neva Boyd: A sociologist, someone who studies how people live together in groups and societies.
- Will Kirk Kaynor: Another politician from Sanborn.
- Otto Puhlman: Also a politician.
See also
 In Spanish: Sanborn (Iowa) para niños
 | Aaron Henry |
 | T. R. M. Howard |
 | Jesse Jackson |

