Santa Rosa, Texas facts for kids
Quick facts for kids
Santa Rosa, Texas
|
|
|---|---|

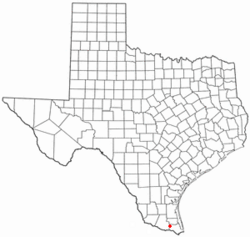
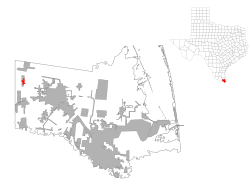
Location of Santa Rosa, Texas
|
|
 |
|
| Country | United States |
| State | Texas |
| County | Cameron |
| Area | |
| • Total | 0.77 sq mi (2.00 km2) |
| • Land | 0.77 sq mi (2.00 km2) |
| • Water | 0.00 sq mi (0.00 km2) |
| Elevation | 49 ft (15 m) |
| Population
(2020)
|
|
| • Total | 2,450 |
| • Density | 3,182/sq mi (1,225/km2) |
| Time zone | UTC-6 (Central (CST)) |
| • Summer (DST) | UTC-5 (CDT) |
| ZIP code |
78593
|
| Area code(s) | 956 |
| FIPS code | 48-65768 |
| GNIS feature ID | 1346669 |
Santa Rosa is a small town located in Cameron County, Texas, United States. In 2020, about 2,450 people lived there.
Santa Rosa is part of a larger area that includes nearby cities like Brownsville, Harlingen, and Raymondville. It also connects to the Matamoros-Brownsville metropolitan area, which crosses the border into Mexico.
Contents
Discover Santa Rosa's Location
Santa Rosa is found in the northwestern part of Cameron County. You can find it at these coordinates: 26°15′24″N 97°49′36″W / 26.25667°N 97.82667°W.
The town is about 6 miles (9.7 km) west of Combes and 7 miles (11 km) east of La Villa. The total area of Santa Rosa is about 0.77 square miles (2.0 square kilometers), and it's all land.
Understanding Santa Rosa's Climate
Santa Rosa has a type of weather called a humid subtropical climate. This means it usually has hot, humid summers and mild winters. On climate maps, this is shown as "Cfa."
The hottest temperature ever recorded in Santa Rosa was 107°F (42°C). This happened on September 6, 2000, and again on June 24, 2017. The coldest temperature ever recorded was 16°F (-9°C) on December 23, 1989.
| Climate data for Santa Rosa, Texas, 1991–2020 normals, extremes 1987–present | |||||||||||||
|---|---|---|---|---|---|---|---|---|---|---|---|---|---|
| Month | Jan | Feb | Mar | Apr | May | Jun | Jul | Aug | Sep | Oct | Nov | Dec | Year |
| Record high °F (°C) | 93 (34) |
98 (37) |
102 (39) |
106 (41) |
105 (41) |
107 (42) |
105 (41) |
105 (41) |
107 (42) |
103 (39) |
99 (37) |
92 (33) |
107 (42) |
| Mean maximum °F (°C) | 86.3 (30.2) |
90.3 (32.4) |
94.3 (34.6) |
96.4 (35.8) |
97.3 (36.3) |
100.2 (37.9) |
101.0 (38.3) |
102.0 (38.9) |
99.7 (37.6) |
96.3 (35.7) |
91.4 (33.0) |
87.1 (30.6) |
103.2 (39.6) |
| Mean daily maximum °F (°C) | 71.3 (21.8) |
75.7 (24.3) |
80.9 (27.2) |
86.4 (30.2) |
90.6 (32.6) |
94.9 (34.9) |
96.3 (35.7) |
97.4 (36.3) |
92.6 (33.7) |
88.0 (31.1) |
79.7 (26.5) |
72.9 (22.7) |
85.6 (29.8) |
| Daily mean °F (°C) | 60.4 (15.8) |
64.4 (18.0) |
69.7 (20.9) |
75.3 (24.1) |
80.7 (27.1) |
84.8 (29.3) |
86.0 (30.0) |
86.4 (30.2) |
82.3 (27.9) |
76.6 (24.8) |
68.4 (20.2) |
61.6 (16.4) |
74.7 (23.7) |
| Mean daily minimum °F (°C) | 48.8 (9.3) |
53.2 (11.8) |
58.4 (14.7) |
64.2 (17.9) |
70.8 (21.6) |
74.7 (23.7) |
75.7 (24.3) |
75.4 (24.1) |
72.0 (22.2) |
65.2 (18.4) |
57.0 (13.9) |
50.2 (10.1) |
63.8 (17.7) |
| Mean minimum °F (°C) | 34.5 (1.4) |
37.4 (3.0) |
42.1 (5.6) |
48.8 (9.3) |
58.6 (14.8) |
69.1 (20.6) |
71.5 (21.9) |
71.3 (21.8) |
63.1 (17.3) |
49.2 (9.6) |
40.6 (4.8) |
34.6 (1.4) |
31.8 (−0.1) |
| Record low °F (°C) | 25 (−4) |
22 (−6) |
30 (−1) |
38 (3) |
50 (10) |
63 (17) |
67 (19) |
66 (19) |
54 (12) |
32 (0) |
32 (0) |
16 (−9) |
16 (−9) |
| Average precipitation inches (mm) | 1.12 (28) |
1.00 (25) |
1.40 (36) |
1.39 (35) |
2.48 (63) |
2.88 (73) |
1.67 (42) |
2.10 (53) |
5.56 (141) |
2.66 (68) |
1.23 (31) |
1.12 (28) |
24.61 (623) |
| Average snowfall inches (cm) | 0.0 (0.0) |
0.0 (0.0) |
0.0 (0.0) |
0.0 (0.0) |
0.0 (0.0) |
0.0 (0.0) |
0.0 (0.0) |
0.0 (0.0) |
0.0 (0.0) |
0.0 (0.0) |
0.0 (0.0) |
0.1 (0.25) |
0.1 (0.25) |
| Average precipitation days (≥ 0.01 in) | 7.0 | 5.5 | 5.8 | 4.7 | 4.6 | 5.2 | 3.8 | 5.2 | 9.4 | 6.1 | 5.7 | 7.2 | 70.2 |
| Average snowy days (≥ 0.1 in) | 0.0 | 0.0 | 0.0 | 0.0 | 0.0 | 0.0 | 0.0 | 0.0 | 0.0 | 0.0 | 0.0 | 0.0 | 0.0 |
| Source 1: NOAA | |||||||||||||
| Source 2: National Weather Service | |||||||||||||
Who Lives in Santa Rosa?
The population of Santa Rosa has changed over the years. Here's how many people have lived there during different census counts:
| Historical population | |||
|---|---|---|---|
| Census | Pop. | %± | |
| 1930 | 737 | — | |
| 1940 | 224 | −69.6% | |
| 1950 | 400 | 78.6% | |
| 1960 | 1,572 | 293.0% | |
| 1970 | 1,466 | −6.7% | |
| 1980 | 1,889 | 28.9% | |
| 1990 | 2,223 | 17.7% | |
| 2000 | 2,833 | 27.4% | |
| 2010 | 2,873 | 1.4% | |
| 2020 | 2,450 | −14.7% | |
| U.S. Decennial Census | |||
2020 Census: A Look at the Community
The 2020 United States census counted 2,450 people living in Santa Rosa. There were 842 households, which are like homes where people live, and 659 families.
The table below shows the different groups of people who live in Santa Rosa. Most people in Santa Rosa are of Hispanic or Latino background.
| Group | Number of People | Percentage of Total |
|---|---|---|
| White (NH) | 66 | 2.69% |
| Black or African American (NH) | 1 | 0.04% |
| Native American or Alaska Native (NH) | 2 | 0.08% |
| Asian (NH) | 4 | 0.16% |
| Pacific Islander (NH) | 1 | 0.04% |
| Some Other Group (NH) | 1 | 0.04% |
| Mixed/Multi-Racial (NH) | 7 | 0.29% |
| Hispanic or Latino | 2,368 | 96.65% |
| Total | 2,450 |
Learning in Santa Rosa: Schools and Education
The Santa Rosa Independent School District is in charge of the schools in Santa Rosa. This district runs a few different schools for students of all ages.
These schools include Santa Rosa High School, Santa Rosa Middle School, and an elementary school that also has a preschool.
Additionally, the South Texas Independent School District offers special "magnet schools" that students from Santa Rosa can attend. These schools often focus on specific subjects like science or technology.
See also
 In Spanish: Santa Rosa (condado de Cameron, Texas) para niños
 | John T. Biggers |
 | Thomas Blackshear |
 | Mark Bradford |
 | Beverly Buchanan |

