South Carthage, Tennessee facts for kids
Quick facts for kids
South Carthage, Tennessee
|
|
|---|---|

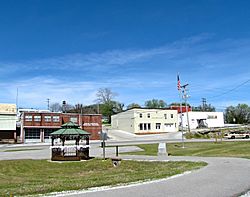
Buildings along Old Highway 53
|
|

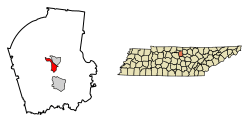
Location of South Carthage in Smith County, Tennessee.
|
|
| Country | United States |
| State | Tennessee |
| County | Smith |
| Area | |
| • Total | 2.64 sq mi (6.84 km2) |
| • Land | 2.56 sq mi (6.64 km2) |
| • Water | 0.08 sq mi (0.20 km2) |
| Elevation | 509 ft (155 m) |
| Population
(2020)
|
|
| • Total | 1,490 |
| • Density | 581.35/sq mi (224.45/km2) |
| Time zone | UTC-6 (Central (CST)) |
| • Summer (DST) | UTC-5 (CDT) |
| FIPS code | 47-69680 |
| GNIS feature ID | 1270836 |
South Carthage is a town in Smith County, Tennessee, USA. It is located right across the Cumberland River from the town of Carthage. In 2020, about 1,490 people lived here.
Contents
Where is South Carthage Located?
South Carthage is found at 36°14′44″N 85°57′29″W / 36.24556°N 85.95806°W. The town stretches along the south bank of the Cumberland River. It goes from Goodall Island all the way to where the Caney Fork river joins the Cumberland.
Major roads like U.S. Route 70N, State Route 25, and State Route 53 pass through South Carthage. The town is connected to Carthage by two bridges. These are the Cordell Hull Bridge and the Veterans Memorial Bridge.
According to the United States Census Bureau, South Carthage covers about 6.8 square kilometers (2.6 square miles) of land. A small part, about 0.2 square kilometers (0.08 square miles), is water.
How Many People Live Here?
The number of people living in South Carthage has changed over the years. Here's a quick look at the population counts:
| Historical population | |||
|---|---|---|---|
| Census | Pop. | %± | |
| 1970 | 859 | — | |
| 1980 | 1,004 | 16.9% | |
| 1990 | 851 | −15.2% | |
| 2000 | 1,302 | 53.0% | |
| 2010 | 1,322 | 1.5% | |
| 2020 | 1,490 | 12.7% | |
| Sources: | |||
People in South Carthage: 2020 Census
The 2020 United States census counted 1,490 people living in South Carthage. There were 536 households and 344 families in the town.
Here's a breakdown of the different groups of people living in South Carthage in 2020:
| Group | Number | Percentage |
|---|---|---|
| White (not Hispanic or Latino) | 1,324 | 88.86% |
| Black or African American (not Hispanic or Latino) | 48 | 3.22% |
| Native American | 3 | 0.2% |
| Asian | 14 | 0.94% |
| Other/Mixed | 52 | 3.49% |
| Hispanic or Latino | 49 | 3.29% |
See also
 In Spanish: South Carthage para niños
 | Delilah Pierce |
 | Gordon Parks |
 | Augusta Savage |
 | Charles Ethan Porter |

