South Fairmount, Cincinnati facts for kids
Quick facts for kids
South Fairmount
|
|
|---|---|
|
Neighborhood of Cincinnati
|
|
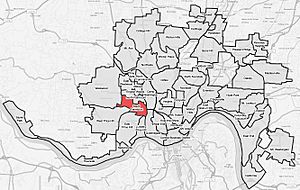
South Fairmount (red) within Cincinnati, Ohio.
|
|
| Country | United States |
| State | Ohio |
| City | Cincinnati |
| Population
(2020)
|
|
| • Total | 2,181 |
| Time zone | UTC-5 (EST) |
| • Summer (DST) | UTC-4 (EDT) |
| ZIP code |
45214
|
South Fairmount is one of the 52 neighborhoods in Cincinnati, Ohio. It is located in the western part of the city. This area has a high number of homes that help people with lower incomes find affordable places to live. In 2020, about 2,181 people lived in South Fairmount.
Contents
Exploring South Fairmount's Past
Fairmount started as a few farm homes in the early 1800s. Later, the Mill Creek valley became a place for factories. The creek bed was built over, and factories were set up at the bottom of the hill. A company that made beer opened in 1825. More beer makers arrived in the following years.
The first new people to move here were from France and Germany. Later, around the year 1900, many Italian families came to the community. Over time, Fairmount grew into different neighborhoods. These include North Fairmount, South Fairmount, Millvale, and English Woods.
Where is South Fairmount Located?
South Fairmount is located just south of the North Fairmount neighborhood. It is part of the larger city of Cincinnati.
Who Lives in South Fairmount?
| Population of South Fairmount 1980-2020 | ||
|---|---|---|
| Year | Pop. | ±% |
| 1980 | 4,104 | — |
| 1990 | 3,998 | −2.6% |
| 2000 | 3,251 | −18.7% |
| 2010 | 2,368 | −27.2% |
| 2020 | 2,181 | −7.9% |
In 2020, a survey showed that 2,181 people lived in South Fairmount. There were 1,096 homes in the neighborhood. The people living there came from many different backgrounds:
- 33.2% were White.
- 58.8% were Black or African American.
- 0.3% were Asian.
- 3.5% were from other races.
- 4.3% were from two or more races.
- About 4.9% of the people were Hispanic or Latino.
There were 853 households in total. About 36.1% of these were families. Also, about 58.3% of all homes were made up of single people living alone.
Looking at age groups:
- 19.4% of the people were under 18 years old.
- 71.3% were between 18 and 64 years old.
- 9.3% were 65 years old or older.
The population was almost evenly split between males and females. About 49.1% were male and 50.9% were female.
The average yearly income for a household in the neighborhood was about $19,343. This information is from a survey done between 2016 and 2020. About 26.3% of families lived below the poverty line. Also, about 16.0% of adults had a college degree or higher.
Improving Local Infrastructure
The Metropolitan Sewer District of Greater Cincinnati (MSD) is working on a project to bring back the Lick Run stream. This stream used to flow between Queen City Avenue and Westwood Avenue. The project is called "stream daylighting." It means bringing a buried stream back to the surface.
MSD needs to stop a lot of dirty water from overflowing into the Mill Creek. This happens during heavy rains because the old sewer system combines rainwater with sewage. The Lick Run area is the biggest source of these overflows. It sends about 1.7 billion gallons of raw sewage into the Mill Creek every year. By separating the rainwater from the sewage, most of the rain can go straight into a creek. This will help stop the overflows.
MSD has two main ideas to fix this problem:
- Daylighting the Stream: The preferred plan is to restore the Lick Run stream. This would allow rainwater to flow into the new stream and then into the Mill Creek. This plan is expected to cost around $195 million. Some people in the community are worried about this plan. They think it might look like an "open drainage ditch." They are also concerned about how it might affect businesses and buildings in the area.
- Building a New Tunnel: The other option is to build a new, larger tunnel. This tunnel would be 25 feet wide, replacing an older, smaller one. This plan would not separate the rainwater from the sewage. This means MSD would still have to treat all the rainwater as if it were sewage. This option is expected to cost about $312 million.
 | Mary Eliza Mahoney |
 | Susie King Taylor |
 | Ida Gray |
 | Eliza Ann Grier |

