Southwark South East (UK Parliament constituency) facts for kids
Quick facts for kids {{{Name}}}[[{{{Type}}} constituency]] |
|
|---|---|
| [[Image:{{{Map1}}}Constituency.svg|120px|]] [[Image:England{{{Map2}}}.svg|120px|]] |
|
| {{{Name}}} shown within [[{{{Entity}}}]], and {{{Entity}}} shown within England | |
| Created: | {{{Year}}} |
| MP: | {{{MP}}} |
| Party: | {{{Party}}} |
| Type: | House of Commons |
| County: | [[{{{County}}}]] |
| EP constituency: | [[{{{EP}}} (European Parliament constituency)|{{{EP}}}]] |
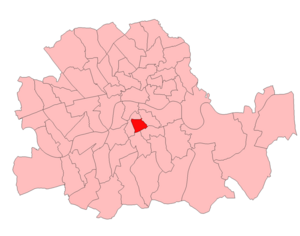
Southwark South East was a special area in South London that elected one person to represent its people in the UK Parliament. This elected person is called a Member of Parliament (MP). MPs work in the House of Commons, which is where laws are made for the whole country.
This area was created for the general election in 1918. It stopped being a separate area for elections in 1950. After that, most of its area became part of the new Southwark constituency.
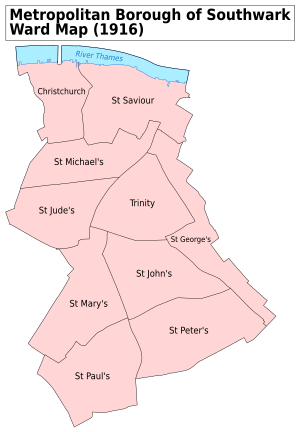
Southwark South East included parts of the Metropolitan Borough of Southwark. It covered areas known as St. George, St. John, and St. Peter. Today, these areas are mostly in East Walworth and Faraday, plus a small part of Grange ward, all within the London Borough of Southwark.
Contents
Who Represented Southwark South East?
This section shows the people who were elected as MPs for Southwark South East. Each MP represented the area for a certain time.
| Election | Member | Party | |
|---|---|---|---|
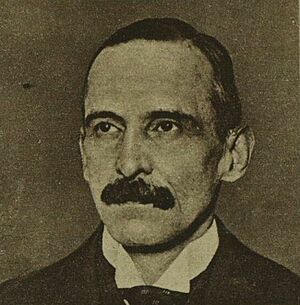
| 1918 | James Arthur Dawes | Coalition Liberal | |
| 1921 by-election | Thomas Naylor | Labour | |
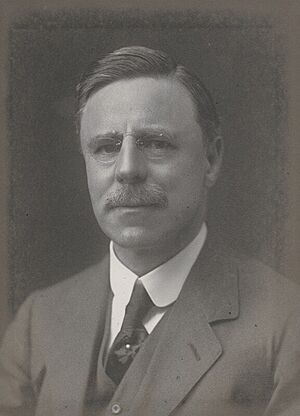
| 1922 | Maurice Alexander | National Liberal | |
| 1923 | Thomas Naylor | Labour | |
| 1931 | George Powell | Conservative | |
| 1935 | Thomas Naylor | Labour | |
| 1950 | Area no longer existed | ||
How Elections Worked
People in Southwark South East voted in several elections to choose their MP. Here's a look at some of those elections.
The 1918 Election
The first election for Southwark South East was in 1918.
| General election 1918: Southwark South East | |||||
|---|---|---|---|---|---|
| Party | Candidate | Votes | % | ±% | |
| C | Liberal | James Arthur Dawes | 7,208 | 72.6 | |
| Labour | Thomas Naylor | 2,718 | 27.4 | ||
| Majority | 4,490 | 45.2 | |||
| Turnout | 9,926 | ||||
| Liberal win (new seat) | |||||
| C indicates candidate endorsed by the coalition government. | |||||
Elections in the 1920s
In 1921, there was a special election called a by-election. This happens when an MP leaves their job before the next general election.
| 1921 Southwark South East by-election | |||||
|---|---|---|---|---|---|
| Party | Candidate | Votes | % | ±% | |
| Labour | Thomas Naylor | 6,561 | 57.0 | +29.6 | |
| National Liberal | Thomas Owen Jacobsen | 2,636 | 22.9 | -49.7 | |
| Ind U | Horace Louis Petit Boot | 2,307 | 20.1 | New | |
| Majority | 3,925 | 34.1 | N/A | ||
| Turnout | 11,504 | 38.5 | -6.7 | ||
| Labour gain from Coalition Liberal | Swing | +39.6 | |||
Another general election took place in 1922.
| General election 1922: Southwark South East | |||||
|---|---|---|---|---|---|
| Party | Candidate | Votes | % | ±% | |
| National Liberal | Maurice Alexander | 10,014 | 56.4 | N/A | |
| Labour | Thomas Naylor | 7,734 | 43.6 | +16.2 | |
| Majority | 2,280 | 12.8 | N/A | ||
| Turnout | 17,748 | 58.2 | |||
| National Liberal gain from Labour | Swing | ||||
The next general election was in 1923.
| General election 1923: Southwark South East | |||||
|---|---|---|---|---|---|
| Party | Candidate | Votes | % | ±% | |
| Labour | Thomas Naylor | 9,374 | 54.3 | +10.7 | |
| Liberal | Maurice Alexander | 7,884 | 45.7 | -10.7 | |
| Majority | 1,490 | 8.6 | N/A | ||
| Turnout | 17,258 | 55.7 | -2.5 | ||
| Labour gain from Liberal | Swing | +10.7 | |||
In 1924, another general election was held.
| General election 1924: Southwark South East | |||||
|---|---|---|---|---|---|
| Party | Candidate | Votes | % | ±% | |
| Labour | Thomas Naylor | 11,635 | 54.3 | 0.0 | |
| Unionist | Geoffrey Lloyd | 7,387 | 34.5 | New | |
| Liberal | Elsie Elias | 2,388 | 11.2 | -34.5 | |
| Majority | 4,248 | 19.8 | +11.2 | ||
| Turnout | 21,410 | 68.1 | +8.4 | ||
| Labour hold | Swing | ||||
The last general election in the 1920s was in 1929.
| General election 1929: Southwark South East | |||||
|---|---|---|---|---|---|
| Party | Candidate | Votes | % | ±% | |
| Labour | Thomas Naylor | 13,527 | 60.4 | +6.1 | |
| Liberal | William John Squire | 4,766 | 21.3 | +10.1 | |
| Unionist | Evelyn George Harcourt Powell | 4,086 | 18.3 | -16.2 | |
| Majority | 8,761 | 39.1 | +19.3 | ||
| Turnout | 22,379 | 58.9 | -9.2 | ||
| Labour hold | Swing | -2.0 | |||
Elections in the 1930s
A general election was held in 1931.
| General election 1931: Southwark South East | |||||
|---|---|---|---|---|---|
| Party | Candidate | Votes | % | ±% | |
| Conservative | Evelyn George Harcourt Powell | 11,063 | 53.3 | +35.0 | |
| Labour | Thomas Naylor | 9,678 | 46.7 | -13.7 | |
| Majority | 1,385 | 6.6 | N/A | ||
| Turnout | 20,741 | 54.1 | -4.8 | ||
| Conservative gain from Labour | Swing | ||||
The next general election was in 1935.
| General election 1935: Southwark South East | |||||
|---|---|---|---|---|---|
| Party | Candidate | Votes | % | ±% | |
| Labour | Thomas Naylor | 11,942 | 63.2 | +16.5 | |
| Conservative | Evelyn George Harcourt Powell | 6,945 | 36.8 | -16.5 | |
| Majority | 4,997 | 26.4 | +19.8 | ||
| Turnout | 18,887 | 53.3 | -0.8 | ||
| Labour gain from Conservative | Swing | ||||
The 1945 Election
The last general election for this constituency was in 1945.
| General election 1945: Southwark South East | |||||
|---|---|---|---|---|---|
| Party | Candidate | Votes | % | ±% | |
| Labour | Thomas Naylor | 9,599 | 76.9 | +13.7 | |
| Conservative | James Greenwood | 2,881 | 23.1 | -13.7 | |
| Majority | 6,718 | 53.8 | +27.4 | ||
| Turnout | 12,480 | 60.8 | +7.5 | ||
| Labour hold | Swing | ||||


