
South London facts for kids
Quick facts for kids
South London
|
|
|---|---|
|
London, south of the Thames
|
|

South London's emergence was a result of the existence and location of London Bridge
|
|
| Sovereign state | United Kingdom |
| Country | England |
| Region | London |
| Area | |
| • Total | 249.34 sq mi (645.78 km2) |
| Population | |
| • Total | 2,835,200 |
| • Density | 11,370.95/sq mi (4,390.35/km2) |
South London is the part of London, England, that lies south of the River Thames. This area includes many different boroughs. Some of these are Bexley, Bromley, Croydon, and Greenwich. Other boroughs are Kingston, Lambeth, Lewisham, and Merton. It also includes Richmond, Southwark, Sutton, and Wandsworth.
South London first grew around Southwark. This area was once called Suthriganaweorc. This name meant 'fort of the men of Surrey'. From Southwark, London then spread into what used to be northern Surrey and western Kent.
Contents
How South London Grew
South London started to grow at Southwark. This was at the southern end of London Bridge. London Bridge was the first lasting bridge over the River Thames. The early growth of South London happened because of this important bridge.
Southwark was first known as Suthriganaweorc. This name meant the fortress of the men of Surrey. It was mentioned in the Burghal Hidage. This was a military plan by Alfred the Great to fight the Great Heathen Army of the Vikings. Southwark was also called the Borough. This was because it was an official borough from 1295.
In 1720, John Strype wrote a 'Survey of London'. He described Southwark as one of London's four main areas. He listed the City of London, Westminster (West London), Southwark (South London), and 'That Part Beyond the Tower' (East London). The area now called North London grew later.
Why South London Grew Slowly at First
For a long time, there were no other bridges across the river. This meant that South London grew much slower than areas north of the Thames. People had to cross London Bridge to get to the south.
The building of Westminster Bridge and other bridges helped South West London grow. However, only Tower Bridge was built east of London Bridge. This meant South East London grew more slowly. This changed when the Surrey Commercial Docks were built.
The Impact of Railways on Growth
In the mid-1800s, many railway lines were built. This made South London grow much faster. In 1899, the County of London was formed. It included boroughs south of the river. These were Wandsworth, Lambeth, Battersea, Camberwell, Southwark, Bermondsey, Deptford, Lewisham, Greenwich, and Woolwich.
Later, towns like Kingston, Croydon, and Bromley joined with South London. This happened during the first half of the 1900s. Finally, Greater London was created in 1965.
Getting Around South London
South London has many bridges connecting it to West London and the City. There are more than thirty such bridges. But there is only one bridge, Tower Bridge, that connects South London to East London.
Underground and Overground Trains
Not much of London's underground train network is south of the river. This is mostly because of the difficult ground conditions. However, new technology makes digging tunnels cheaper now. This might lead to more underground lines in South London. There are plans for the Crossrail 2 line. Also, extensions are planned for the Northern and Bakerloo Lines.
South London has a large overground train network. All of London's trams also run within this area.
Boroughs in South London
Here are the 12 boroughs that are fully or partly in South London:
| London borough | Postcode areas | 2008 sub-region | London Assembly | Historic county | Inner London/Outer London | |
|---|---|---|---|---|---|---|
| Bexley | DA, SE | South East | Bexley and Bromley | Kent | Outer London | |
| Bromley | BR, DA, SE, TN, CR | South East | Bexley and Bromley | Kent | Outer London | |
| Croydon | CR, SE, SW, BR | South West | Croydon and Sutton | Surrey | Outer London | |
| Greenwich | SE, DA, BR | South East | Greenwich and Lewisham | Kent | Inner London
(Outer London for statistics) |
|
| Kingston | KT, SW, | South West | South West | Surrey | Outer London | |
| Lambeth | SE, SW | South East | Lambeth and Southwark | Surrey | Inner London | |
| Lewisham | SE, BR | South East | Greenwich and Lewisham | Kent | Inner London | |
| Merton | CR, SM, SW | South West | Merton and Wandsworth | Surrey | Outer London | |
| Richmond (part) | TW,SW | South West | South West | Surrey | Outer London | |
| Southwark | SE | South East | Lambeth and Southwark | Surrey | Inner London | |
| Sutton | SM, KT, | South West | Croydon and Sutton | Surrey | Outer London | |
| Wandsworth | SW | South West | Merton and Wandsworth | Surrey | Inner London |
A very small piece of land at the southern end of Blackfriars Bridge is not part of Southwark. It belongs to the City of London. The City of London is a special local authority. Most of it is located north of the Thames.
South London's Weather
South London has a temperate maritime climate. This means it has mild temperatures and rain throughout the year. This is like other parts of London and the UK. Three weather stations collect climate data south of the river. These are Kew, Hampton, and Kenley Airfield. Kenley Airfield is on the southern edge of the city.
Temperatures get warmer closer to the Thames. This is because of the city's warming effect. Also, the land is lower closer to the river. This means the southern parts of South London are often a bit cooler. Sometimes, you can see snow on the North Downs near Croydon. But central London might not have any snow.
The hottest temperature ever recorded at Greenwich was 37.5 °C (99.5 °F). This happened in August 2003. The amount of sunshine is less than at other London weather stations. This might mean Greenwich gets more fog in winter. Also, the hills to the south might block the sun in the morning and evening.
The highest temperature recorded across South London was 38.1 °C (100.6 °F) at Kew Gardens. This happened at the same time as the Greenwich record.
| Climate data for Greenwich 7m asl 1971–2000, | |||||||||||||
|---|---|---|---|---|---|---|---|---|---|---|---|---|---|
| Month | Jan | Feb | Mar | Apr | May | Jun | Jul | Aug | Sep | Oct | Nov | Dec | Year |
| Mean daily maximum °C (°F) | 7.9 (46.2) |
8.2 (46.8) |
10.9 (51.6) |
13.3 (55.9) |
17.2 (63.0) |
20.2 (68.4) |
22.8 (73.0) |
22.6 (72.7) |
19.3 (66.7) |
15.2 (59.4) |
10.9 (51.6) |
8.8 (47.8) |
14.8 (58.6) |
| Mean daily minimum °C (°F) | 2.4 (36.3) |
2.2 (36.0) |
3.8 (38.8) |
5.2 (41.4) |
8.0 (46.4) |
11.1 (52.0) |
13.6 (56.5) |
13.3 (55.9) |
10.9 (51.6) |
8.0 (46.4) |
4.8 (40.6) |
3.3 (37.9) |
7.2 (45.0) |
| Average precipitation mm (inches) | 51.9 (2.04) |
34.0 (1.34) |
42.0 (1.65) |
45.2 (1.78) |
47.2 (1.86) |
53.0 (2.09) |
38.3 (1.51) |
47.3 (1.86) |
56.9 (2.24) |
61.5 (2.42) |
52.3 (2.06) |
54.0 (2.13) |
583.6 (22.98) |
| Mean monthly sunshine hours | 45.9 | 66.1 | 103.2 | 147.0 | 185.4 | 180.6 | 190.3 | 194.4 | 139.2 | 109.7 | 60.6 | 37.8 | 1,461 |
| Source: MetOffice | |||||||||||||
Images for kids
-
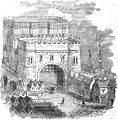
The heads of traitors were displayed on spikes, on the southern gatehouse of London Bridge
-
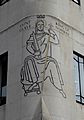
St Olaf's House, Southwark. Olaf, later St Olaf, helped the English retake London Bridge from his fellow Norsemen.

_-_Copy.jpg)

