Spring Mill, Kentucky facts for kids
Quick facts for kids
Spring Mill, Kentucky
|
|
|---|---|

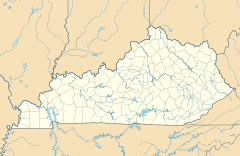
Location of Spring Mill in Jefferson County, Kentucky
|
|
| Country | United States |
| State | Kentucky |
| County | Jefferson |
| Area | |
| • Total | 0.06 sq mi (0.14 km2) |
| • Land | 0.06 sq mi (0.14 km2) |
| • Water | 0.00 sq mi (0.00 km2) |
| Elevation | 650 ft (200 m) |
| Population
(2020)
|
|
| • Total | 294 |
| • Density | 5,250.00/sq mi (2,040.14/km2) |
| Time zone | UTC-5 (Eastern (EST)) |
| • Summer (DST) | UTC-4 (EDT) |
| ZIP Code |
40228
|
| FIPS code | 21-72770 |
| GNIS feature ID | 2405507 |
Spring Mill is a small city in Jefferson County, Kentucky, United States. It is known as a "home rule-class city," which means it has the power to manage its own local affairs. In 2020, the city had a population of 294 people. This was a slight increase from 287 people counted in the 2010 census.
Contents
Where is Spring Mill Located?
Spring Mill is found in the southern part of Jefferson County. It is about 12 miles (19 kilometers) southeast of the main city center of Louisville.
How Big is Spring Mill?
According to the United States Census Bureau, Spring Mill covers a total area of about 0.06 square miles (0.14 square kilometers). All of this area is land, meaning there are no large bodies of water within the city limits.
Who Lives in Spring Mill?
The population of Spring Mill has changed over the years. Here's how many people have lived there during different census counts:
| Historical population | |||
|---|---|---|---|
| Census | Pop. | %± | |
| 1990 | 342 | — | |
| 2000 | 380 | 11.1% | |
| 2010 | 287 | −24.5% | |
| 2020 | 294 | 2.4% | |
| U.S. Decennial Census | |||
What is the Population Like?
In 2000, there were 380 people living in Spring Mill. Most residents were White (98.42%). A small number were Asian (0.53%) or from two or more races (1.05%). About 1.32% of the population identified as Hispanic or Latino.
There were 130 households in the city. Many of these (86.9%) were married couples living together. About 35.4% of households had children under 18 living with them. The average household had about 2.92 people.
What are the Ages of Residents?
The median age in Spring Mill in 2000 was 43 years old. This means half the people were younger than 43 and half were older.
- 25.8% of residents were under 18 years old.
- 5.8% were between 18 and 24 years old.
- 21.8% were between 25 and 44 years old.
- 33.9% were between 45 and 64 years old.
- 12.6% were 65 years or older.
What About Income?
In 2000, the typical income for a household in Spring Mill was $73,250 per year. For families, the typical income was $72,750. The average income per person was $29,849. No families or individuals were reported to be living below the poverty line.
Images for kids
See also
 In Spanish: Spring Mill (Kentucky) para niños
 | George Robert Carruthers |
 | Patricia Bath |
 | Jan Ernst Matzeliger |
 | Alexander Miles |


