St. Peter, Illinois facts for kids
Quick facts for kids
St. Peter, Illinois
|
|
|---|---|

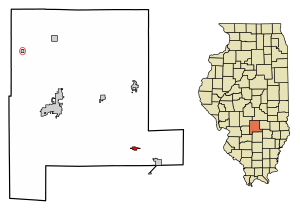
Location of St. Peter in Fayette County, Illinois.
|
|

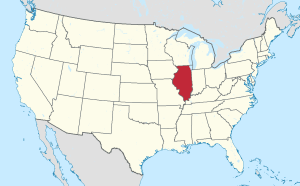
Location of Illinois in the United States
|
|
| Country | United States |
| State | Illinois |
| County | Fayette |
| Township | Lone Grove |
| Area | |
| • Total | 0.52 sq mi (1.35 km2) |
| • Land | 0.52 sq mi (1.35 km2) |
| • Water | 0.00 sq mi (0.00 km2) |
| Elevation | 591 ft (180 m) |
| Population
(2020)
|
|
| • Total | 322 |
| • Density | 618.04/sq mi (238.81/km2) |
| Time zone | UTC-6 (CST) |
| • Summer (DST) | UTC-5 (CDT) |
| ZIP Code(s) |
62880
|
| Area code(s) | 618 |
| FIPS code | 17-67132 |
| GNIS feature ID | 2399171 |
| Wikimedia Commons | St. Peter, Illinois |
St. Peter is a small village located in Fayette County, Illinois, in the United States. In 2020, about 322 people lived there. It is also sometimes called Saint Peter.
Contents
Where is St. Peter Located?
St. Peter is found in the southeastern part of Fayette County. A road called Illinois Route 185 goes right through the village.
This road leads about 17 miles (27 km) northwest to Vandalia. Vandalia is the main town, or county seat, of Fayette County. The same road also goes southeast about 6.5 miles (10.5 km) to Farina.
Land Area of St. Peter
According to information from 2021, St. Peter covers a total area of about 0.52 square miles (1.35 square kilometers). All of this area is land.
Who Lives in St. Peter?
The number of people living in St. Peter changes over time. Here is a look at how the population has changed since 1910:
| Historical population | |||
|---|---|---|---|
| Census | Pop. | %± | |
| 1910 | 313 | — | |
| 1920 | 396 | 26.5% | |
| 1930 | 251 | −36.6% | |
| 1940 | 348 | 38.6% | |
| 1950 | 354 | 1.7% | |
| 1960 | 397 | 12.1% | |
| 1970 | 380 | −4.3% | |
| 1980 | 372 | −2.1% | |
| 1990 | 353 | −5.1% | |
| 2000 | 386 | 9.3% | |
| 2010 | 359 | −7.0% | |
| 2020 | 322 | −10.3% | |
| U.S. Decennial Census | |||
Population in 2020
In 2020, there were 322 people living in St. Peter. These people lived in 152 different homes, and 103 of these were families. The village had about 618 people per square mile (239 people per square kilometer).
Most people in St. Peter were White (98.45%). A small number (1.55%) were from two or more races. About 0.31% of the population was Hispanic or Latino.
Households and Families
Out of the 152 homes, about 36.2% had children under 18 living there. More than half (57.24%) were married couples. About 10.53% of homes had a female head of household without a husband.
About 25.66% of all homes had only one person living in them. Many of these (17.76%) were people aged 65 or older living alone. On average, there were 3.45 people in each home and 2.88 people in each family.
Age Groups
The people in St. Peter are of different ages. About 33.1% of the population was under 18 years old. About 17.6% were 65 years old or older. The average age in the village was 32.2 years.
Income in St. Peter
In 2020, the average income for a home in St. Peter was $50,938. For families, the average income was $58,438. The average income per person in the village was $21,471.
About 15.5% of families and 13.3% of all people lived below the poverty line. This included 21.1% of children under 18 and 9.1% of people aged 65 or older.
See also
 In Spanish: St. Peter para niños
 | Sharif Bey |
 | Hale Woodruff |
 | Richmond Barthé |
 | Purvis Young |

