
Student's t-distribution facts for kids
The Student's t-distribution is a special type of probability distribution. It was created by William Sealy Gosset in 1908. He used the pseudonym "Student" when he published his work.
Think of it this way: a normal distribution describes a very large group, like an entire population. But the t-distribution helps us understand smaller groups, called "samples," that are taken from a larger population. Each time you take a different size sample, the t-distribution changes a little. The bigger your sample, the more the t-distribution starts to look like a normal distribution.
This distribution is super useful in many statistical studies. For example, it helps scientists figure out if the difference between two groups of data is real or just by chance. It's also used to create confidence intervals, which are like a range where a true value is likely to be found. It even helps in linear regression analysis, which is about finding relationships between different pieces of data.
Contents
Who Invented the Student's t-Distribution?
William Sealy Gosset worked at a brewery (a place where beer is made). He was very interested in problems that involved small groups of data. For example, he might have needed to test the chemical qualities of barley using only a few samples. Sometimes, he only had three samples to work with! Because the samples were so small, it was hard to figure out the usual spread of the data. Also, he often didn't know the exact probability distribution of the samples he was studying.
There are a couple of stories about why Gosset used the name "Student." One idea is that his employer preferred staff to use pen names when publishing scientific papers. This was to keep their real identities private. Another story suggests the brewery didn't want other companies to know they were using this special t-test to check the quality of their ingredients.
What Are the Features of the t-Distribution?
The t-distribution looks like a bell, just like the normal distribution. It is also symmetrical, meaning it looks the same on both sides. However, the t-distribution has "heavier tails." This means it's more likely to have values that are far away from its middle point (the mean).
This "heavier tails" feature is really helpful. It allows the t-distribution to better handle situations where you might get some unusual or extreme results. For example, if you are looking at ratios of numbers, and the bottom number of the ratio is very small, it can make the overall result look very big or very small. The t-distribution helps statisticians understand these kinds of situations better.
Related Topics
- F-distribution
Images for kids
-

This graph shows the probability density function (PDF) of the Student's t-distribution. It looks like a bell shape.
-
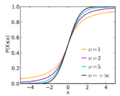
This graph shows the cumulative distribution function (CDF) of the Student's t-distribution. It shows the probability of a value being less than or equal to a certain point.
-
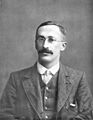
Statistician William Sealy Gosset, who was known by his pen name "Student."


See also
 In Spanish: Distribución t de Student para niños
