Sugar City, Colorado facts for kids
Quick facts for kids
Sugar City, Colorado
|
|
|---|---|
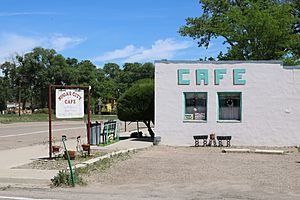
Cafe along Colorado Street (2017)
|
|
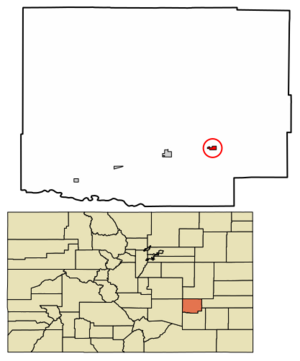
Location within Crowley County and Colorado
|
|
| Country | United States |
| State | Colorado |
| County | Crowley |
| Incorporated | July 2, 1900 |
| Area | |
| • Total | 0.39 sq mi (1.00 km2) |
| • Land | 0.39 sq mi (1.00 km2) |
| • Water | 0.00 sq mi (0.00 km2) |
| Elevation | 4,305 ft (1,312 m) |
| Population
(2020)
|
|
| • Total | 259 |
| • Density | 664/sq mi (259.0/km2) |
| Time zone | UTC−7 (MST) |
| • Summer (DST) | UTC−6 (MDT) |
| ZIP Code |
81076
|
| Area code | 719 |
| FIPS code | 08-74815 |
| GNIS ID | 195392 |
Sugar City is a small town located in Crowley County, Colorado, in the United States. In 2020, about 259 people lived there. It's known for its history with sugar production.
Contents
A Sweet History: Sugar City's Past
Sugar City got its name because it was once a big center for making sugar. A post office opened here in 1900.
The Sugar Beet Factory
The town was named after its sugar beet factory, which started operating in 1899. This factory was owned by the National Beet Sugar Company. It played a huge role in the town's early days.
However, during a dry period in the 1950s, the factory's wastewater ponds dried up. This caused a very strong, unpleasant smell that spread across the town. The factory eventually closed its doors in 1967.
Where is Sugar City?
Sugar City is found in the southeastern part of Crowley County, Colorado. You can find it at these coordinates: 38°13′55″N 103°39′53″W / 38.23194°N 103.66472°W.
Getting Around
Colorado State Highway 96 passes through the area. If you travel west on this highway for about 5 miles (8 km), you'll reach Ordway, which is the county seat. Going northeast for about 33 miles (53 km) will take you to Haswell.
Size of the Town
According to the United States Census Bureau, Sugar City covers a total area of about 0.4 square miles (1.0 square kilometer). All of this area is land, with no water.
How Many People Live Here?
The number of people living in Sugar City has changed over the years. Here's a look at the population counts from different U.S. Decennial Censuses:
| Historical population | |||
|---|---|---|---|
| Census | Pop. | %± | |
| 1900 | 689 | — | |
| 1910 | 808 | 17.3% | |
| 1920 | 836 | 3.5% | |
| 1930 | 598 | −28.5% | |
| 1940 | 565 | −5.5% | |
| 1950 | 527 | −6.7% | |
| 1960 | 409 | −22.4% | |
| 1970 | 307 | −24.9% | |
| 1980 | 306 | −0.3% | |
| 1990 | 252 | −17.6% | |
| 2000 | 279 | 10.7% | |
| 2010 | 258 | −7.5% | |
| 2020 | 259 | 0.4% | |
| U.S. Decennial Census | |||
See also
 In Spanish: Sugar City (Colorado) para niños
 | Georgia Louise Harris Brown |
 | Julian Abele |
 | Norma Merrick Sklarek |
 | William Sidney Pittman |

