
Sundown, Texas facts for kids
Quick facts for kids
Sundown, Texas
|
|
|---|---|

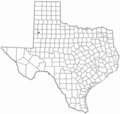
Location of Sundown, Texas
|
|
 |
|
| Country | United States |
| State | Texas |
| County | Hockley |
| Area | |
| • Total | 1.52 sq mi (3.94 km2) |
| • Land | 1.52 sq mi (3.94 km2) |
| • Water | 0.00 sq mi (0.00 km2) |
| Elevation | 3,540 ft (1,079 m) |
| Population
(2020)
|
|
| • Total | 1,283 |
| • Density | 844.1/sq mi (325.6/km2) |
| Time zone | UTC-6 (Central (CST)) |
| • Summer (DST) | UTC-5 (CDT) |
| ZIP code |
79372
|
| Area code(s) | 806 |
| FIPS code | 48-71060 |
| GNIS feature ID | 1369397 |
Sundown is a small town located in Hockley County, Texas, in the United States. It's known for its community school district, Sundown ISD. In 2020, about 1,283 people lived there. This was a bit less than the 1,397 people counted in 2010.
Contents
Where is Sundown?
Sundown is located in the western part of Texas. Its exact location is 33.457018 degrees North and -102.488283 degrees West. This helps people find it on a map!
The city covers a total area of about 1.5 square miles (or 3.9 square kilometers). All of this area is land, meaning there are no large lakes or rivers within the city limits.
Who Lives in Sundown?
Every ten years, the United States counts its population. This is called a census. It helps us understand how many people live in different places and what groups they belong to.
Population Changes Over Time
The number of people living in Sundown has changed over the years. Here's a quick look at the population counts from different censuses:
| Historical population | |||
|---|---|---|---|
| Census | Pop. | %± | |
| 1950 | 1,492 | — | |
| 1960 | 1,186 | −20.5% | |
| 1970 | 1,129 | −4.8% | |
| 1980 | 1,511 | 33.8% | |
| 1990 | 1,759 | 16.4% | |
| 2000 | 1,505 | −14.4% | |
| 2010 | 1,397 | −7.2% | |
| 2020 | 1,283 | −8.2% | |
| U.S. Decennial Census | |||
As you can see, the population has gone up and down. It was highest in 1990 with 1,759 people and lowest in 1970 with 1,129 people.
People of Sundown in 2020
The 2020 census showed that 1,283 people lived in Sundown. These people made up 488 households, and 378 of these were families.
The census also looks at the different backgrounds of people living in a city. Here's a breakdown of the main groups in Sundown in 2020:
| Race | Number | Percentage |
|---|---|---|
| White (NH) | 597 | 46.53% |
| Black or African American (NH) | 16 | 1.25% |
| Native American or Alaska Native (NH) | 4 | 0.31% |
| Some Other Race (NH) | 4 | 0.31% |
| Mixed/Multi-Racial (NH) | 16 | 1.25% |
| Hispanic or Latino | 646 | 50.35% |
| Total | 1,283 |
This table shows that in 2020, the largest group in Sundown was Hispanic or Latino people, making up over half of the population. White (Non-Hispanic) people were the next largest group.
Images for kids
-
Location of Sundown, Texas
-

Map of Hockley County showing Sundown
See also
 In Spanish: Sundown (Texas) para niños
