
Swan Valley, Idaho facts for kids
Quick facts for kids
Swan Valley, Idaho
|
|
|---|---|

U.S. Route 26, entering Swan Valley, ID
|
|

Location of Swan Valley in Bonneville County, Idaho.
|
|
| Country | United States |
| State | Idaho |
| County | Bonneville |
| Area | |
| • Total | 11.66 sq mi (30.19 km2) |
| • Land | 11.48 sq mi (29.73 km2) |
| • Water | 0.17 sq mi (0.45 km2) |
| Elevation | 5,282 ft (1,610 m) |
| Population
(2010)
|
|
| • Total | 204 |
| • Density | 21.34/sq mi (8.24/km2) |
| Time zone | UTC-7 (Mountain (MST)) |
| • Summer (DST) | UTC-6 (MDT) |
| ZIP code |
83449
|
| Area code(s) | 208, 986 |
| FIPS code | 16-79120 |
| GNIS feature ID | 2412020 |
Swan Valley is a small city located in Bonneville County, Idaho, in the United States. It is part of the larger Idaho Falls area. In 2010, about 204 people lived there.
Contents
Where is Swan Valley Located?
Swan Valley covers about 11.6 square miles (30 square kilometers). Most of this area is land, with a small part being water.
What is the Climate Like?
Swan Valley has a type of climate called a "warm-summer humid continental climate." This means it has warm summers and cold, snowy winters.
The hottest temperature ever recorded in Swan Valley was 103°F (39°C) on September 4, 2022. The coldest temperature recorded was -43°F (-42°C). This happened on January 19, 1963, and again on December 22, 1990.
| Climate data for Swan Valley, Idaho, 1991–2020 normals, extremes 1960–present | |||||||||||||
|---|---|---|---|---|---|---|---|---|---|---|---|---|---|
| Month | Jan | Feb | Mar | Apr | May | Jun | Jul | Aug | Sep | Oct | Nov | Dec | Year |
| Record high °F (°C) | 55 (13) |
60 (16) |
72 (22) |
83 (28) |
91 (33) |
101 (38) |
101 (38) |
101 (38) |
103 (39) |
89 (32) |
72 (22) |
58 (14) |
103 (39) |
| Mean maximum °F (°C) | 42.4 (5.8) |
47.6 (8.7) |
59.3 (15.2) |
73.3 (22.9) |
80.5 (26.9) |
87.4 (30.8) |
93.8 (34.3) |
93.1 (33.9) |
87.6 (30.9) |
76.0 (24.4) |
60.0 (15.6) |
45.1 (7.3) |
95.2 (35.1) |
| Mean daily maximum °F (°C) | 30.4 (−0.9) |
34.7 (1.5) |
45.0 (7.2) |
56.1 (13.4) |
65.9 (18.8) |
74.9 (23.8) |
84.9 (29.4) |
84.2 (29.0) |
74.5 (23.6) |
59.3 (15.2) |
43.0 (6.1) |
31.6 (−0.2) |
57.0 (13.9) |
| Daily mean °F (°C) | 20.7 (−6.3) |
24.2 (−4.3) |
33.3 (0.7) |
41.6 (5.3) |
50.3 (10.2) |
57.8 (14.3) |
65.3 (18.5) |
64.2 (17.9) |
55.9 (13.3) |
43.9 (6.6) |
31.6 (−0.2) |
22.0 (−5.6) |
42.6 (5.9) |
| Mean daily minimum °F (°C) | 11.0 (−11.7) |
13.8 (−10.1) |
21.5 (−5.8) |
27.2 (−2.7) |
34.6 (1.4) |
40.7 (4.8) |
45.8 (7.7) |
44.2 (6.8) |
37.4 (3.0) |
28.5 (−1.9) |
20.3 (−6.5) |
12.4 (−10.9) |
28.1 (−2.2) |
| Mean minimum °F (°C) | −12.1 (−24.5) |
−6.9 (−21.6) |
4.2 (−15.4) |
16.2 (−8.8) |
22.7 (−5.2) |
30.8 (−0.7) |
36.9 (2.7) |
34.7 (1.5) |
26.0 (−3.3) |
14.8 (−9.6) |
2.8 (−16.2) |
−8.3 (−22.4) |
−16.4 (−26.9) |
| Record low °F (°C) | −43 (−42) |
−36 (−38) |
−25 (−32) |
−3 (−19) |
12 (−11) |
20 (−7) |
26 (−3) |
23 (−5) |
8 (−13) |
−5 (−21) |
−21 (−29) |
−43 (−42) |
−43 (−42) |
| Average precipitation inches (mm) | 1.85 (47) |
1.32 (34) |
1.54 (39) |
1.88 (48) |
2.53 (64) |
2.07 (53) |
1.25 (32) |
1.25 (32) |
1.55 (39) |
1.81 (46) |
1.59 (40) |
1.44 (37) |
20.08 (511) |
| Average snowfall inches (cm) | 16.7 (42) |
9.1 (23) |
4.4 (11) |
1.6 (4.1) |
0.2 (0.51) |
0.0 (0.0) |
0.0 (0.0) |
0.0 (0.0) |
0.0 (0.0) |
0.5 (1.3) |
4.0 (10) |
8.5 (22) |
45.0 (114) |
| Average precipitation days (≥ 0.01 in) | 9.9 | 8.9 | 10.2 | 12.1 | 13.0 | 10.1 | 7.9 | 7.8 | 7.6 | 8.3 | 8.5 | 9.3 | 113.6 |
| Average snowy days (≥ 0.1 in) | 6.4 | 3.8 | 1.7 | 0.8 | 0.0 | 0.0 | 0.0 | 0.0 | 0.0 | 0.2 | 1.9 | 4.8 | 19.6 |
| Source 1: NOAA | |||||||||||||
| Source 2: National Weather Service | |||||||||||||
Population of Swan Valley
| Historical population | |||
|---|---|---|---|
| Census | Pop. | %± | |
| 1950 | 203 | — | |
| 1960 | 217 | 6.9% | |
| 1970 | 235 | 8.3% | |
| 1980 | 135 | −42.6% | |
| 1990 | 141 | 4.4% | |
| 2000 | 213 | 51.1% | |
| 2010 | 204 | −4.2% | |
| 2019 (est.) | 245 | 20.1% | |
| U.S. Decennial Census | |||
The population of Swan Valley has changed over the years. In 1950, there were 203 people. By 2010, the population was 204. In 2019, it was estimated that about 245 people lived there.
Who Lives in Swan Valley?
Based on the 2010 census, 204 people lived in Swan Valley. There were 92 households and 66 families. The city had about 17.7 people per square mile.
Most of the people living in Swan Valley (96.6%) were White. A small number were Native American (1.0%) or Asian (0.5%). About 1.5% of the population identified as Hispanic or Latino.
In the households, 20.7% had children under 18. Most households (65.2%) were married couples. About 26.1% of all households were single individuals. The average household had 2.22 people.
The average age of people in Swan Valley was 47.8 years old. About 18.1% of residents were under 18. Many residents (35.3%) were between 45 and 64 years old. About 20.6% were 65 or older. The number of males and females was about equal.
Interesting Facts about Swan Valley
- An old story from 1868 talks about a "Swan Valley Monster" seen in the Snake River.
Images for kids
-
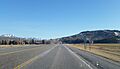
U.S. Route 26, entering Swan Valley, ID
-
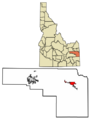
Location of Swan Valley in Bonneville County, Idaho.
See also
 In Spanish: Swan Valley (Idaho) para niños
